Test NanoTrader Full I Test Tradingview I Test the mobile platforms All for CFD-Forex & Futures
You are here
The Heikin Ashi histogram
A new client proposal has been added to the trading platform. The Heikin Ashi Histogram converts the popular Heikin Ashi candles into a an easy-to-interpret histogram.
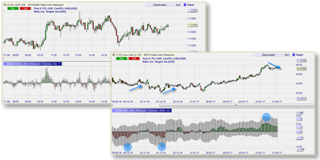
You can use the histogram to spot overbought and oversold market situations which may be trading signals. Changes from red to green or green to red around the zero-line also have the potential of being used as trading signals if in the direction of the trend. Download a free real-time demo of the NanoTrader Full.
Free demo

Trading videos
Charting, strategies, automated trading, backtesting, playback... watch these videos and become a platform master.

Broker
WH SelfInvest serves traders from offices in Germany, France, Switzerland, Belgium, Luxemburg and the Netherlands.
The spectacular SignalRadar
SignalRadar shows live trades being executed by various trading strategies.
More ...
- ‹ previous
- 2 of 5
- next ›