Test NanoTrader Full I Test Tradingview I Test the mobile platforms All for CFD-Forex & Futures
You are here
Fading, a trading strategy
The importance of trading in the direction of the trend is drilled into novice day traders and quite rightly so. When going with the flow, the timing of the entry becomes less important as the probability of being postioned in the right direction is higher. Nevertheless, trading against the trend, sometimes called Countertrend trading, can also be lucrative on the condition that the trader knows precisely what he is doing. Fading is not recommended to all, but those traders who have a good knowledge of technical analysis and who are experienced in interpreting charts may find Fading an interesting day trading strategy.
What is Fading?
Fading consists of taking an opposite position after a movement with strong momentum. This is based on the idea that the market price will make up some of its lost ground again immediately after a strong movement i.e. the market price will slightly return to the recent average price. One of the reasons is that momentum traders, after a strong momentum-driven movement, will take their profits, driving the market price back to the recent average.
When do the ‘Faders’ appear
Fading traders consciously go against the flow, which, at the time they open their positions, is still strong. Hence the timing is crucial. Imagine a herd running towards you. Fading traders cannot by themselves turn the herd around, so they need to pick their time precisely when the herd turns. If they do so and the herd turns, it tends to run with some élan in the other direction.
A few Fading trading examples
Carrefour, 5-minute chart
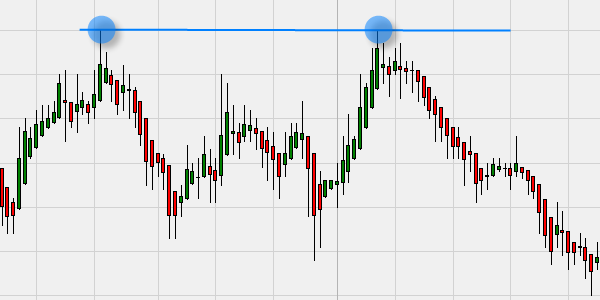
Carrefour rises immediately after the open at 9h00 to a high of 21,60 € (second blue circle) in a movement with strong momentum. This high corresponds to the high of the day before (first blue circle). Immediately after reaching 21,60 € the market loses momentum, indicating an opportunity for Fading traders. A profit of around 15 cents presents itself.
Siemens, 5-minute chart
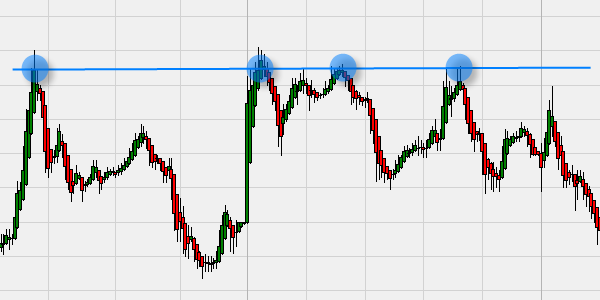
During the morning Siemens rises in one swift movement on strong momentum to 79,20 € at 11h30 (fourth blue circle). In previous days this price level already appeared as resistance over the past two days. Siemens loses momentum and an opportunity for the Fading traders presents itself. A potential profit of around 40 cents presents itself.
Unilever, 5-minute chart
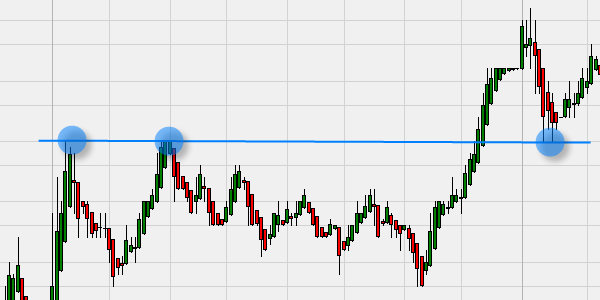
Unilever moves downwards on strong momentum and reaches around 16h00 a support price of 30,63 € (third blue circle). This exact price level corresponds to a swing level high the day before. The downward momentum fades, presenting traders who apply the Fading trading strategy with an opportunity. A potential profit of around 15 cents presents itself.
Download a free real-time demo of the NanoTrader Full
Free demo

Trading videos
Charting, strategies, automated trading, backtesting, playback... watch these videos and become a platform master.

Broker
WH SelfInvest serves traders from offices in Germany, France, Switzerland, Belgium, Luxemburg and the Netherlands.
The spectacular SignalRadar
SignalRadar shows live trades being executed by various trading strategies.
More ...
- 1 of 5
- next ›