Test NanoTrader Full I Test Tradingview I Test the mobile platforms All for CFD-Forex & Futures
You are here
The ABCD pattern goes against the trend
The ABCD tool is an easy-to-use tool which takes the complexity out of drawing the popular ABCD chart pattern. The ABCD chart pattern allows traders to determine when a trend may weaken and reverse. Trading signals can be derived from the pattern.
These are the advantages of the ABCD drawing tool:
- The ABCD chart pattern is automatically completed in the chart.
- The trader must not do any of the Fibonacci calculations. They are automated.
- The trader sees ahead when there may be a trade opportunity.
- The trader sees ahead at which price level there may be a trade opportunity.
1. THE ABCD PATTERN
Traders know that after a pronounced trend the market is likely to reverse direction. ABCD pattern traders try to identify the second time when a trend loses steam and may reverse. In other words they are looking for a short sell opportunity in a market which is going up and they are looking for a buy opportunity in a market which is going down. Although such behaviour goes against the classic trader mantra “the trend is your friend” it fits with the human reflex of trying to buy something when the price has gone down.
The ABCD pattern is easy to understand and, some traders say, reliable as it is calculated on the basis of Fibonacci levels. The pattern consists of:
- The initial spike or trend (AB).
- The reversal (BC).
- The expected new trend (CD).
- More about Fibonacci levels in NanoTrader: The automated drawing of correct Fibonacci levels.
2. DRAWING THE PATTERN USING THE TOOL
The trader draws AB and BC. The tool calculates and draws CD using Fibonacci levels. When drawing AB and BC the trader must respect these criteria:
- B must be significantly higher than A.
- A must absolutely be the lowest point in AB.
- BC must at least be 50% smaller than AB.
3. TRADING THE ABCD PATTERN
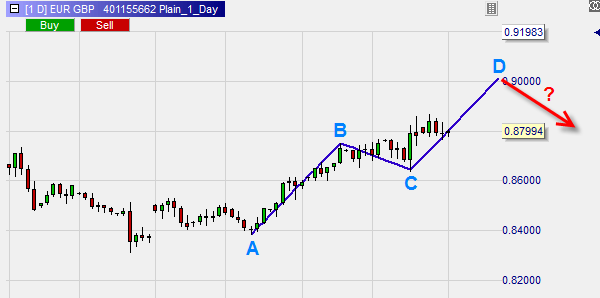
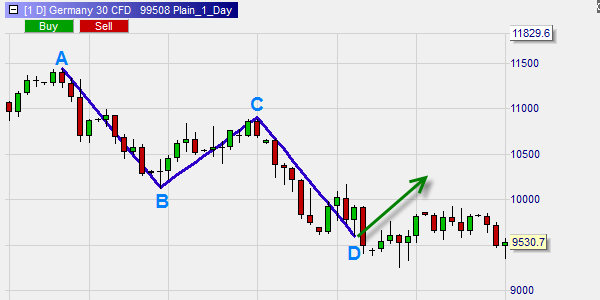
The trader expects the market to evolve along CD. What happens if the market does indeed evolve along CD and reaches D? In the case of a bullish market the trader will sell short. In the case of a bearish market the trader will buy.
This example shows a bullish market. The trader expects the market to evolve along the line CD. If D is reached he will look for a short sell opportunity.

This example shows a bearish market. The market did indeed evolve along the line CD. When D was reached no buy opportunity presented itself. No trade could be done.
The ABCD pattern can be used in all time frames and for all instruments.
Traders use different techniques to identify entry points when D is indeed reached. Some want to see a market structure point (market structure low for a buy, market structure high for a short), others want to see the market move in the expected direction and, for example, move above the high of a few candles back.
4. CONCLUSION
The ABCD tool is a versatile tool which takes all the complexity out of drawing the ABCD chart pattern.
€uro am Sonntag broker test:
„The lowest price broker. The best order execution.“
The respected finance magazine "€uro am Sonntag" tested 13 CFD-Forex broker on 733 criteria. In this wide-ranging test of the brokerage industry broker WH SELFINVEST came in first, once more.

Try a few trading strategies... download a real-time NanoTrader Full demo.
Free demo

Trading videos
Charting, strategies, automated trading, backtesting, playback... watch these videos and become a platform master.

Broker
WH SelfInvest serves traders from offices in Germany, France, Switzerland, Belgium, Luxemburg and the Netherlands.
The spectacular SignalRadar
SignalRadar shows live trades being executed by various trading strategies.
More ...
- ‹ previous
- 3 of 5
- next ›