Test NanoTrader Full I Test Tradingview I Test the mobile platforms All for CFD-Forex & Futures
You are here
Famous traders and their zigzag
Many well-known traders apply some form of zigzag as part of their trading approach. In essence a zigzag is a visualisation of the Dow theory (higher highs and lower lows). How the zigzag is drawn tends to be very similar but what really differs from professional trader to professional trader is how they trade the different price levels and zones which a zigzag generates. The NanoTrader contains the zigzags of several famous traders and shows you their key trading levels and zones.
These are the advantages of the zigzag drawing tools:
- The key trading levels and zones of several famous traders are indicated.
- The levels and zones can be used for automated orders.
- The drawing tools can be used in all time frames.
- The drawing tools are free.
- A detailed explanation of how to draw zigzags is provided.
- No programming is required.
The points connected by a zigzag are also known in Dow theory as higher highs and lower lows. The zones created by drawing a zigzag are interpreted and used differently by different traders. For the purposes of this article we will take as the example Erdal Cene's zigzag tool and how he uses it when trading.
1. RELEVANT ZONES AND WHAT TO DO
Erdal Cene’s zigzag drawing tool divides every chart into 4 zones based on the zigzag trendline and the current market price.
In this example the market is in a positive trend (bullish).
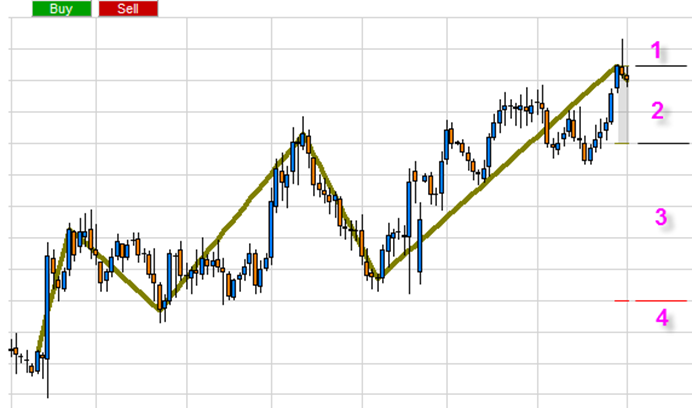
- Zone 1 - the trend continuation zone. In this zone the market is going in the direction of the trend. The tool will continue to extend the trendline if further highs are reached. There are no trading opportunities in this zone.
- Zone 2 - the sideways zone. In this zone the market is going sideways. In this zone there are no trading opportunities.
- Zone 3 - the buy zone. In this zone the market has gone down but the bullish trend is intact. This zone offers buy opportunities. The author does not indicate when to buy. He rightly suggests that the type of signal used is less important than correctly identifying the buy zone.
- Zone 4 - the end-of-the-trend zone. The red line indicates the level at which the current trend comes to an end. Once the candle closes below this line, the drawing tool will stop drawing. The red line is based on the zigzag trendline. It is, however, not simply the low of the last progression. In order to take into account market volatility around this key level the red line is calculated using the instrument’s ATR.
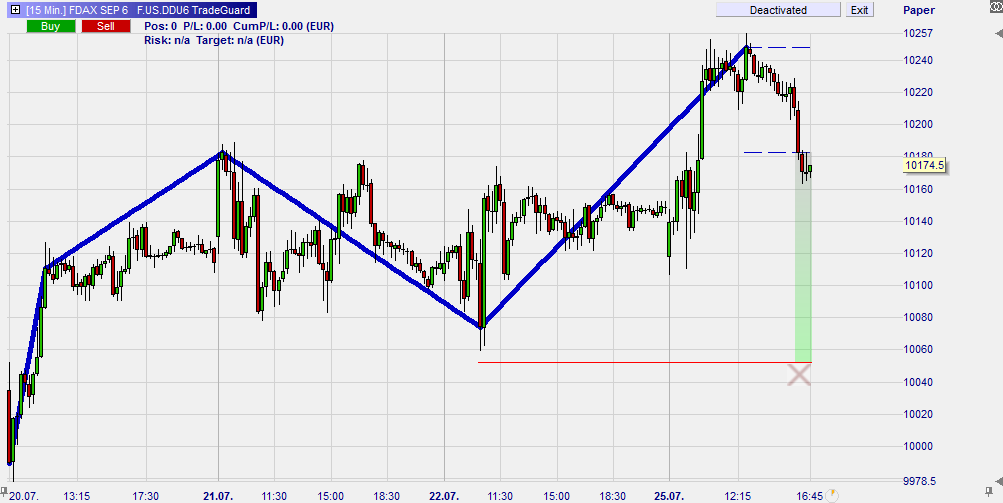
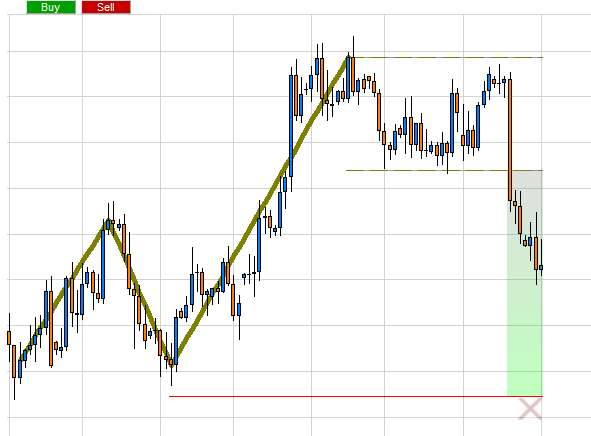
To open a position in the buy zone, each trader can pick the signal type(s) which he prefers. In his book Erdal Cene analyzes several signal types such as hammer candles, market structure points and support levels. When the market price moves into the buy zone the chart looks like this: in green, the buy zone and at the bottom, indicated with crosses, the end-of-the-trend zone.
2. TRADER ERDAL CENE INSISTS
A trader must buy each time there is a buy signal in the buy zone. A signal can either result in a profitable or a non-profitable trade. One does not know in advance. Hence the importance of reacting to all signals. It is the only way the trader can make certain he is in position for the big, profitable trades.
A trader must curb his natural reflex to not trade or, even worse, to short sell when the market is very low in the buy zone. Indeed, the lower the market in the buy zone, the stronger the argument to buy. These are the occasions when the potential profit is at its highest. Hence the buy zone is green at the bottom and only grey-green at the top. As visually indicated by the crosses, never buy below the buy zone.
The Erdal Cene zigzag is available for free in the NanoTrader trading platform.
3. TRADING VIDEOS
This video shows how to draw the trend correctly.
This video shows higher highs and lower lows (Dow theory) in small timeframes.
This video shows higher highs and lower lows (Dow theory) in medium timeframes.
This video shows the combination of different timeframes and introduces the popular Twincharts.
3. THE ZIGZAG OF MICHAEL VOIGT
Michael Voigt is another trader who uses a zigzag as part of his Marktechnik trading strategy. His zigzag drawing tool, which is also available for free in the NanoTrader platform, divides the chart in 3 key zones. These 3 zones, which Voigt considers crucial, are the following:
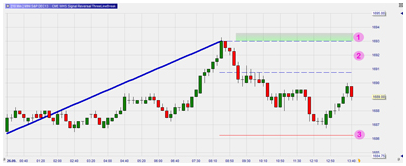
- The buy (or short sell) zone. Around this price level positions are opened. The level is drawn as a small coloured zone. Green for the buy zone, red for the short sell zone. The zone will only appear in the chart when the market closes below (above) the sideways zone.
- The sideways zone. The sideways zone is indicated by two dotted blue lines.
- The end-of-the-trend level. When a candle closes below this level, a bullish trend ends. When a candle closes above this level, a bearish trend ends.
This example shows a bullish trend. The market closed below the sideways zone (2). As a consequence the green buy zone (1) appears in the chart. Michael Voigt will buy a long position when the market breaks into the green zone.
Michael Voigt programmed his Markttechnik package and makes it available in the trading store. The package draws all his different zigzag lines automatically.
4. TRADING LIKE MICHAEL VOIGT
The NanoTrader platform is the only platform capable of implementing Michael Voigt's trading strategy. He combines his three trading techniques into one position; buy 3 contracts, sell 1 manually with a small profit (break-out trading), sell 1 based on the trailing stop (movement trading) and sell 1 based on the zigzag trendline stop (trend trading). Sounds complicated? It absolutely isn’t with NanoTrader.
Some feedback from traders using the NanoTrader via Broker WH SelfInvest:
NanoTrader is my fourth and by far the best trading platform. – H.B.
It is incredible what your trading platform can do. – N.R.
NanoTrader is a reliable and robust trading platform. – C.U.
The NanoTrader leaves no desire unmet. – W.G.
Free demo

Trading videos
Charting, strategies, automated trading, backtesting, playback... watch these videos and become a platform master.

Broker
WH SelfInvest serves traders from offices in Germany, France, Switzerland, Belgium, Luxemburg and the Netherlands.
The spectacular SignalRadar
SignalRadar shows live trades being executed by various trading strategies.
More ...
- 1 of 5
- next ›