Test NanoTrader Full I Test Tradingview I Test the mobile platforms All for CFD-Forex & Futures
You are here
Charts
Every time frame is possible in NanoTrader. Traders are not limited to a fixed menu containing only popular time frames. Charts can be based on time, but also on other parameters such as movement.
The advantages for traders using charts are:
- Every time frame is possible.
- Quick load list of favourite time frames.
- Use proposed chart horizons or select your own.
- Filter charts to exclude data which you do not consider relevant.
- Fast loading historic data.
- No time limits on loading historic data.
- Charts not based on time are also available.
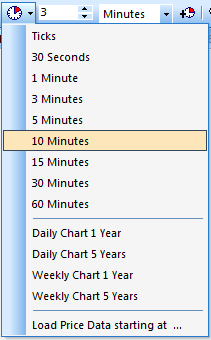
1. TIME-BASED CHARTS
Either select a time frame from the drop down quick load list or enter the timeframe you want.
2. FILTER DATA
Traders can opt to only display see those portions of a chart in which they are interested (e.g: remove pre-market, only show the hours during which you trade, only show the hours during which an instrument is most volatile, etc.).
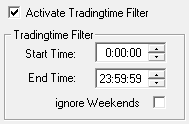
Filtered charts can also be back-tested. This allows traders to test strategies on particular points in time. Some trading strategies which only trade during particular periods of the day, can have impressive results.
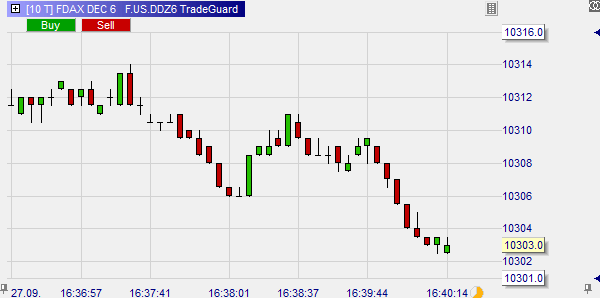
3. TICK CHARTS
Tick charts are a type of chart which is not based on time. NanoTrader will draw a candle every time after a number of ticks defined by the user takes place. This results in charts which accelarate or slow down in function of the number of trades.
This example shows a 10-ticks chart of the DAX future. Every time 10 trades are done in the market a candle based on the execution prices is drawn. Note the irregular time axis.
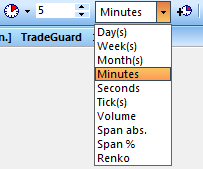
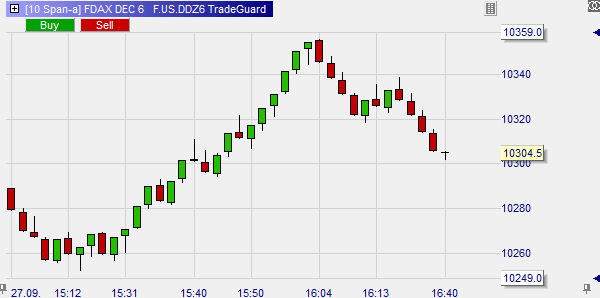
4. MOVEMENT-BASED CHARTS
Charts not based on time are usually based on movement. In particular the size of a movement is important in technical analysis. Users of non-time based charts state that „One trades movement and not time, hence movement-based charts are key“. Various movement-based charts exist. The most telling are Span charts. Span refers to the size of the movement. The span can be expressed in points, ticks or even percent.
This example shows a 10 points span chart of the DAX future. Every time a movement of at least 10 points has taken place, a candle is drawn. If, for example, the market goes sideways in a narrow range, no candle will be drawn. Notice the irregular time axis.
An example of a trading strategy using movement-based charts is the WL Day Trading System.
If you are interested in movement-based charts you may also want to read this article: 3-line break charts and signals.
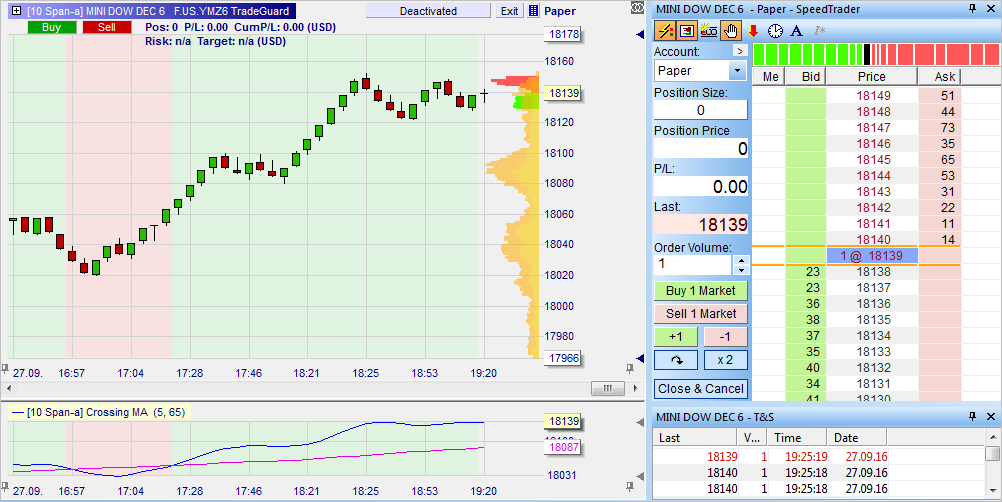
5. FUTURES TRADING
The futures quotes provided in NanoTrader are real tick-by-tick quotes (CQG or Patsystems), as opposed to, for example, the 1/2-second snapshot quotes provided by Interactive Brokers. Up to 10 order books can be opened in parallel, showing each up to 20 lines.
Time & Sales data includes the volume of the executed orders. The Time & Sales data can also be shown as an histogram in the chart. In addition Time & Sales can also show all changes in the bid and ask of the order book.
Long historical data is available and subsequent maturities of the same future are ‚attached‘ into one chart. This is the only valid solution to perform rigourous technical analysis on futures.
This example shows the order book and the Time & Sales data of the mini-DOW future.
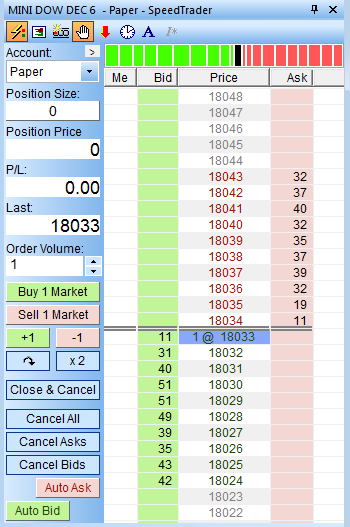
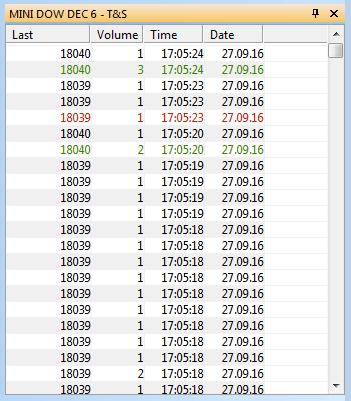
The information provided by the order book and time&sales is very rich. This free e-book TRADER PROFILE - THE SCALPER explains how futures traders and scalpers can use the market data provided by the futures markets.
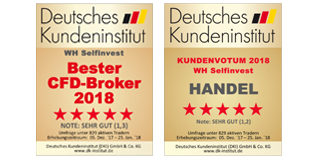
Deutsches Kundeninstitut (German Clients Institute) broker comparison:
"It gives me great pleasure to inform you that WH SelfInvest scores 5 out of 5 stars with the BEST possible mention , "extremely good" (1,3). This makes you de best CFD-Broker for 2018. Congratulations!"
These are the scores of WH SelfInvest in the sub-categories:
- Order execution: 5 out of 5 stars. Mention: very good (1,2).
- Trading platform: 5 out of 5 stars. Mention: very good (1,1).
- Mobile trading: 5 out of 5 stars. Mention: very good (1,1).
- Customer service: 5 out of 5 stars. Mention: very good (1,4).
Improve your trading experience... test a free real-time demo of the NanoTrader trading platform.
Free demo

Trading videos
Charting, strategies, automated trading, backtesting, playback... watch these videos and become a platform master.

Broker
WH SelfInvest serves traders from offices in Germany, France, Switzerland, Belgium, Luxemburg and the Netherlands.
The spectacular SignalRadar
SignalRadar shows live trades being executed by various trading strategies.
More ...
- ‹ previous
- 3 of 5
- next ›