Test NanoTrader Full I Test Tradingview I Test the mobile platforms All for CFD-Forex & Futures
You are here
Compare trading days
Daytraders and scalpers use small chart aggregations. This almost microscopic view allows them to react immediately to any short term market move. By zooming in, they risk losing their sense of market proportions. They basically have no situational awareness of the market they are trading. The Day Comparer gives the trader an excellent feel of the current market, its proportions and volatility.
These are the advantages of the Day Comparer:
- Traders can compare the relative size of market movements.
- Traders see the size of the opening gaps.
- Traders see how the (intra-day) volatility evolves.
- Traders see how the market evolves during the day and over time.
- Traders can compare selected periods of every trading day.
Test the Day Comparer tool: download a free real-time demo of the NanoTrader Full
1. AN EXAMPLE: SEE THE BIG PICTURE
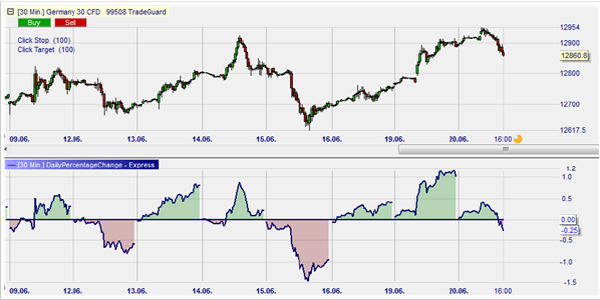
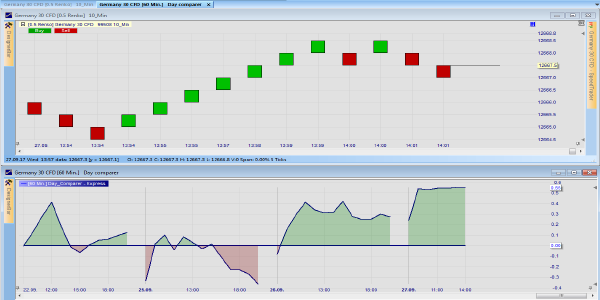
This trader uses a renko chart to scalp the Germany 30 CFD. His trade screen consists of a 0,5 renko tick chart on top, combined with a 60-minute chart showing the Day Comparer. While the upper chart is tick based and only showing the last 10 minutes or so, the Day Comparer shows the last few days of trading to help him keep track of the bigger picture. Notice how the Day Comparer bundles 3 crucial pieces of information.
- Has the market recently been up or down the last few days?
- Where was today’s open compared to the close of the day before?
- What’s the relative size of today’s range compared to the ranges in the rest of the period?
Free real-time NanoTrader demo
2. INTUITIVE SUPPORT
The strong point of the Day Comparer tool is its intuitive graphical character. Let’s have a look at another example:
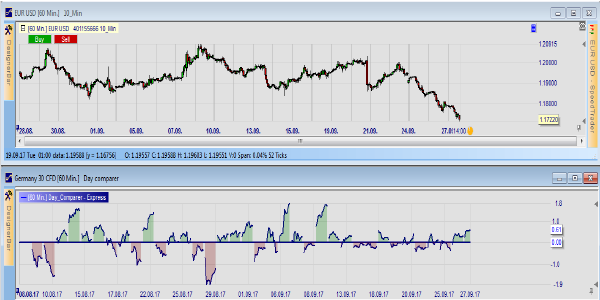
This is the EUR-USD chart over the last 50 days. It is immediately clear that the last two weeks have been relatively calm trading days compared to the wilder moves before. We can intuitively understand that because of the difference in deviations from the centre line. This market insight is not clear at all in the main candle chart.
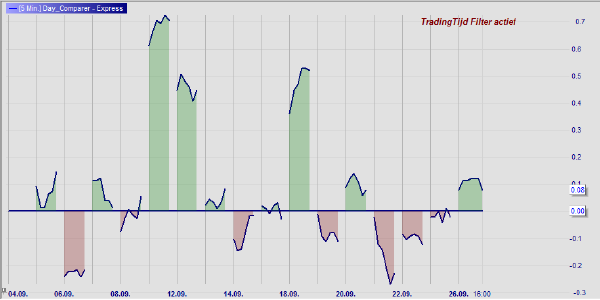
3. KEY MOMENTS
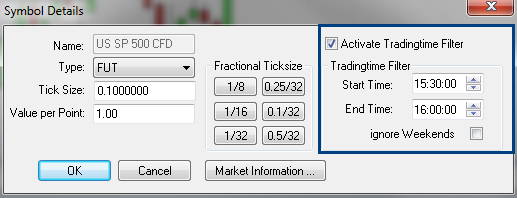
Many traders use a particular period during the trading session as a guideline for their trading during the rest of the day. For example a trader might analyse the market activity during the first 30 minutes of trading to get an idea of the sentiment on the trading floor. Day Comparer allows you to determine the exact period you would like to see via the TradingTime Filter in the Symbol Details. In this example the TradingTime Filter would be set up to start at 15.30 and end at 16.00.
Free real-time NanoTrader demo
Let’s have a look at the next example. This trader likes to trade blue chip U.S. stock CFDs on an intraday basis. His trading day starts at 15.30. The first 30 minutes on the S&P500 are his reference for the rest of the day. He has the Day Comparer set up to only show the slot between 15h30 and 16h00. He is going to be cautious because he observes low volatility. Firstly, the market opened with nearly no gap compared to the day before. Secondly, during the first 30 minutes of the session the market does not move substantially compared to other days. This extremely valuable information can be seen in the Day Comparer chart. This unique tool is exclusive to the NanoTrader platform and is available in both the Free and the Full versions.
Free real-time NanoTrader demo
€uro am Sonntag broker test:
„The lowest price broker. The best order execution.“
The respected finance magazine "€uro am Sonntag" tested 13 CFD-Forex broker on 733 criteria. In this wide-ranging test of the brokerage industry broker WH SELFINVEST came in first, once more.

Explore the Day Comparer... download a free real-time NanoTrader demo.
- Tip: the day comparer is located in the WHS Proposals folder in NanoTrader.
Free demo

Trading videos
Charting, strategies, automated trading, backtesting, playback... watch these videos and become a platform master.

Broker
WH SelfInvest serves traders from offices in Germany, France, Switzerland, Belgium, Luxemburg and the Netherlands.
The spectacular SignalRadar
SignalRadar shows live trades being executed by various trading strategies.
More ...
- ‹ previous
- 3 of 5
- next ›