Test NanoTrader Full I Test Tradingview I Test the mobile platforms All for CFD-Forex & Futures
You are here
Discover Ichimoku
Technical analysis with Ichimoku is integrated in the NanoTrader trading platform. Ichimoku consists of several indicators, which are all a variation of the same idea. The system provides information to traders:
- Support levels
- Resistance Levels
- Trend direction
- Momentum in the market
DO NOT GET DISCOURAGED
Ichimoku demands a lot of time and effort from the trader to learn how to interpret and implement the signals correctly. Knowing all the Ichimoku components does not happen from one day to the next. However, some traders swear by this system and would never use any other approach to technical analysis. They like the quality and accuracy of the signals. If there is only one thing you can remember, remember that the quality of the signal is best when the Ichimoku cloud and the market price go in the same direction.
The NanoTrader trading platform includes two free Ichimoku-based trading strategies:
The strategy Ichimoku Tenkan Sen Kijun Sen Cross.
The strategy Ichimoku Kumo Breakout.
TRADING THE ICHIMOKU WAY
How can Ichimoku charts become a part of your strategy analysis? These Japanese charts look at the markets from a different perspective compared to the usual bar, candle and line charts with the indicators shown below. They help to visualize the constant change in trend of a chart. The daily price movement affects the general strength of trend and momentum on the chart and the clouds catch it. Each trend moves in waves, with the cycles forming retracements as part of a natural process, each time affecting the momentum as a positive or negative factor. This is a key feature that Ichimoku charting attempts to capture visually.
Think back for a moment. When you first started using candle charts, it was probably a little revelation to see how the patterns appearing everywhere on the charts could actually help identify turning points and reversal signals. Ichimoku works in the same way, helping to identify trend and momentum changes by providing a visually superior idea of where potential support and resistance areas lie on the chart through trend and momentum analysis. Ichimoku's second concept is to provide a forward projection on the chart by drawing lines and configurations using the current price. This is a big change from conventional indicators like the MACD, which form buy and sell signals only after the event. It is literally a forward-thinking chart.
Emergence from Moving Average Lines
The "Ichimoku Kinko Hyo" chart was developed before the Second World War by Goichi Hosoda, a journalist from Tokyo. Although the indicator was created over seventy years ago, its popularity in the West did not begin until the 1990s. The chart presents four features dynamically (1) the strength of the trend, (2) the direction of the trend, (3) support and (4) resistance areas. The word "Ichimoku" can be translated as "one look" and the whole name stands for "cloud equilibrium chart at a glance".
Understanding the basics
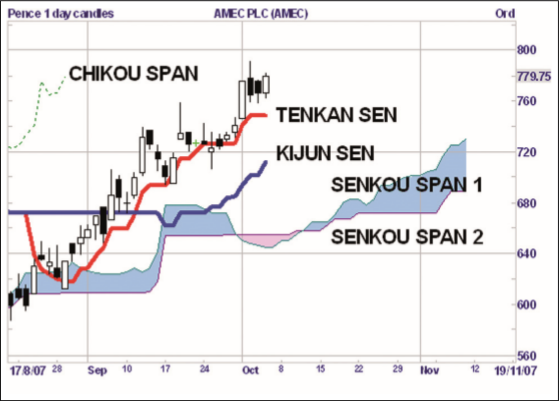
What kind of indicator is it? It is a trend-following indicator and therefore the usual caveats apply when trying to use it in markets with little data or in trendless markets. Traditionally, midday prices are used instead of closing prices. This can lead to a clearer picture, especially in markets where closing prices are artificially inflated by hectic buy orders, seconds before the end of trading. The chart consists of three major components (see Figure 1).
1. The basis is a normal candle chart.
2. Two moving averages are plotted, the "Tenkan Sens" and the "Kijin Sens". Their crosses are used to generate buy and sell signals. This is similar to the "dead cross" and the "golden cross" in the more common systems with moving averages with 50-day and 200-day crosses.
3. Two further lines are drawn, "Senkou or Leading Span 1", a derivative of the Tenkan and Kijin Sens, and "Senkou or Leading Span 2", a mean baseline derived from the high and low of a given period. By filling the space between these two lines, it creates the Ichimoku "cloud component", which represents specific areas of support and resistance.
Figure 1. The Ichimoku Kinko Hyo chart.
The structure of the chart (see Figure 1)
For the moving averages:
- "Tenkan Sen" or Turning Line - is calculated from (Highest High + Lowest Low) / 2, data from the last 9 periods.
- "Kijun Sen" or standard line - is calculated from (Highest High + Lowest Low) / 2, data of the last 26 periods.
For the two main lines that must be calculated and displayed to make the cloud visible:
- Senkou "Leading" Span 1 = (Standard Line + Turning Line) / 2, drawn 26 periods in advance of the current period.
- Senkou "Leading" Span 2 = (Highest High + Lowest Low) / 2 from the last 52 periods, drawn 26 periods in advance of the current period.
Options for thinking ahead
The chart is based on the basic principles of support and resistance and assumes that "support that has been confirmed" will continue to serve as support and only become resistance once it has been broken through. Because the leading spans are plotted 26 periods in advance, better analysis of the support and resistance areas is possible, and the clouds dynamically adjust in width, providing additional indications to determine their strength. This can help reduce the risk of trading false break-outs.
From theory to practice
Even though it might sound a bit complex at first, Ichimoku can be used for daily trading quite easily, once you have understood some basic principles. Let's look at an example and break the technique down into an easy-to-use trading strategy.
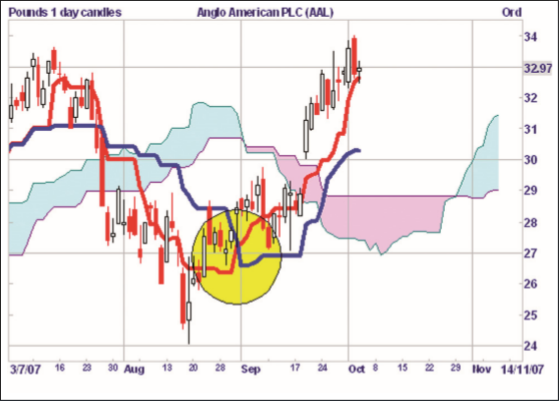
1. On the chart, a buy signal is generated when the Tenkan Sen (red line) crosses the Kijun Sen (blue line) upwards, and a sell signal is generated when the Tenkan crosses the Kijun downwards. Let's look at the buy signal on Anglo American PLC in the yellow circle (see Figure 2).
2. Let us now look at the cloud called "Kumo": this is the area between Senkou Span A and B. It is colored blue and pink in figure 2. This support and resistance band is wider and more useful compared to a single trend line. The thicker the cloud, the greater the volatility in previous price movements. A special feature to note is the gap that the price formed beyond the cloud on September 17thSehen wir uns jetzt die „Kumo“ genannte Wolke an: Das ist der Bereich zwischen Senkou Span A und B. Er ist in Bild 2 blau und pink eingefärbt. Dieses Unterstützungs- und Widerstandsband ist im Vergleich zu einer einzelnen Trendlinie breiter und brauchbarer. Je dicker die Wolke, desto größer war die Volatilität bei den vorangegangenen Kursbewegungen. Eine Besonderheit, die es zu beachten gilt ist die Lücke, die der Kurs am17. September über die Wolke hinaus bildete.
Figure 2. Anglo American Plc.
Ichimoku zur Verbesserung einfacher Trading-Strategien
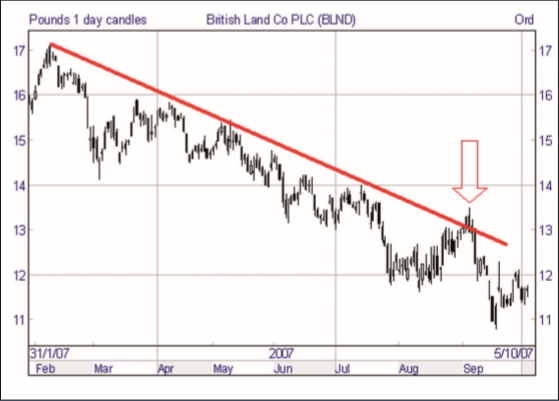
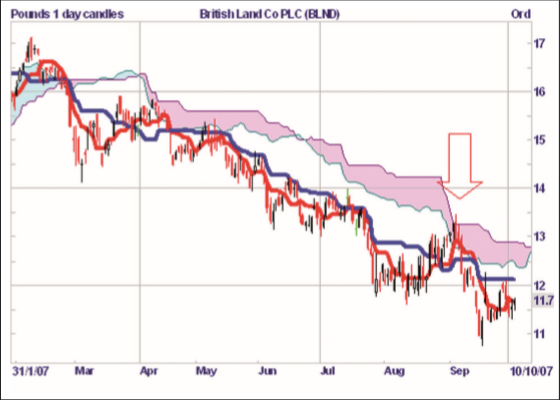
Let's look at a comparative example where Ichimoku can take advantage of its ability to incorporate volatility into its support and resistance bands. This chart shows a confirmed downtrend with resistance represented by the red trend line above the prices. Early September 2007, at 1.10 pm, a classic buy-signal in the form of a breakout through the 6-month resistance line on the daily chart of British Land Plc is given (see red arrow in Figure 3).
Figure 3. British Land Plc., daily chart.
Let's have a look at the Ichimoku chart now: here, a buy signal was given when the Tenkan crossed the Kijun in late August 2007 (the red line crosses the blue line). In this case, a resistance band in the shape of a cloud lies above this area. The chart suggests that long positions should be entered when the price pattern breaks above the cloud's area at around 13.30. This should be seen as an additional filter that can help prevent trading false breakouts.
Note also the behaviour of the Kijun Sen (blue line) in Figure 4, which represented a resistance level from May to August.
Figure 4 The Ichimoku chart.
Gain an advantage
Traditionally, Ichimoku charts are used in the time frame of one day, but they can add value in both weekly and shorter time frames. The periods used to calculate the Tenkan (nine business days in 1.5 weeks) and Kijun (26 business days in a month) were derived from the number of trading days in Japan at the time the ichimoku was created. At that time, a working week in Japan consisted of six days, and it could be argued that a change to five days, as is common in the Western system today, would produce better results and improve the system. As with all technical analysis, you are invited to experiment and try out what works best for you.
The timing of strategies in Ichimoku trading
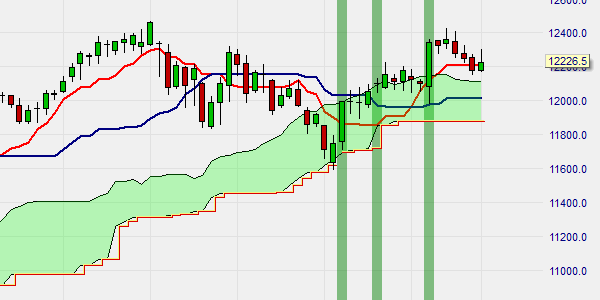
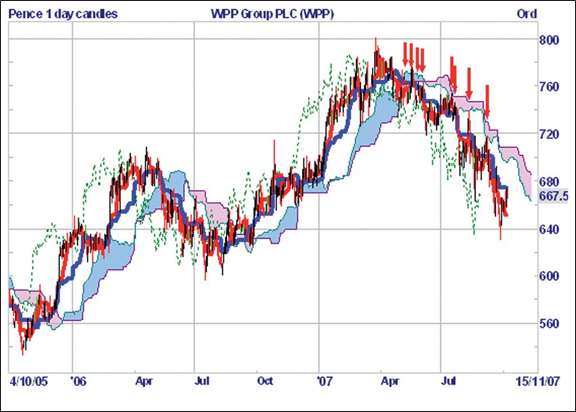
With the analysis of a longer-term Ichimoku weekly chart over a period of two years (see Figure 5), we can now put this recent bullish movement in perspective with the rhythm of the ups and downs of this stock. It is good to see how the price moves above and below the clouds. This is a stock with strong trends, so we can assume that Ichimoku is working well. On this chart we have added Chikou Span (a lagging span indicator). This is the current price shifted back by 26 periods, shown as a dotted green line. Chikou Span provides additional information by comparing it with the current price. It can be used to find support and resistance -the Tenkan and Kijun lines- in the clouds.
Figure 5 Ichimoku weekly chart over a period of two years.
Ichimoku in a trend system
1. In trend. Here you can see that and how Ichimoku works best in a strong trend environment. Avoid using it in trendless markets.
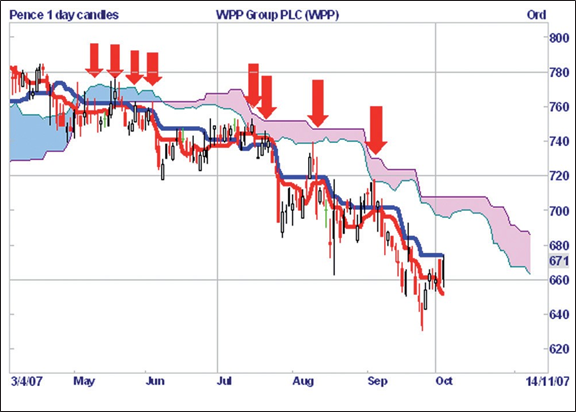
2. Easily recognizable patterns. The six-month chart (see Figure 6) from WPP Group Plc shows that the resistance represented by the cloud has slowed the price down. This resulted in a series of low-risk trading opportunities where a short position was taken with a relatively tight stop.
3. Only select the best when there are multiple signals. On the left side of Figure 6 in the area of the blue cloud in May, a signal cluster can be seen (indicated by red downward arrows on the chart). Further signals are to be seen on the chart in July, August.
4. Entry signal. The strategy here would be to enter a short position as soon as the price touches the cloud with a candle reversal pattern and place the stop loss above the cloud.
5. Simple stop-loss points. A price movement beyond the cloud indicates that the resistance is broken and the trade has failed, so the stop loss should take effect at that point. With this system we have a quite successful trigger for this stock with a stop which is easy to place.
6. Money and risk management. Use a simple money and risk management plan before you trade. Follow precisely defined rules to control the position.
The break through a cloud is our first signal for a trend change and from here we will see favorable setups. Remember that the price must first break through the cloud before the setups are shown.
Figure 6 WPP Group Plc., six-monthly chart
Ichimoku can produce excellent results in combination with candle patterns that signal a return to trend in charts with strong trends. The system described above can be used quite manually and requires some visual interpretation of the chart. When the trend comes to an end after a long period of time and the market begins to consolidate, there is always the possibility that a number of trades will be stopped. At such points, money and risk management are crucial.
Ichimoku may seem a bit intimidating at first, but in trend markets it can generate trading signals with a profit/loss ratio of over 50 percent, and price movements are quite strong after the entry signals due to the nature of the support and resistance characteristics.
Ichimoku provides clear trading signals, but must be used in conjunction with a good money and risk management plan.
Rakesh Shah

Rakesh Shah is a professional trader specializing in advanced trading strategies, who had previously been working as an investment banker in London and Wall Street since 1995. He also runs training courses. Source: Traders' Mag.

Free demo

Trading videos
Charting, strategies, automated trading, backtesting, playback... watch these videos and become a platform master.

Broker
WH SelfInvest serves traders from offices in Germany, France, Switzerland, Belgium, Luxemburg and the Netherlands.
The spectacular SignalRadar
SignalRadar shows live trades being executed by various trading strategies.
More ...
- ‹ previous
- 3 of 5
- next ›