Test NanoTrader Full I Test Tradingview I Test the mobile platforms All for CFD-Forex & Futures
You are here
The Heikin Ashi Histogram
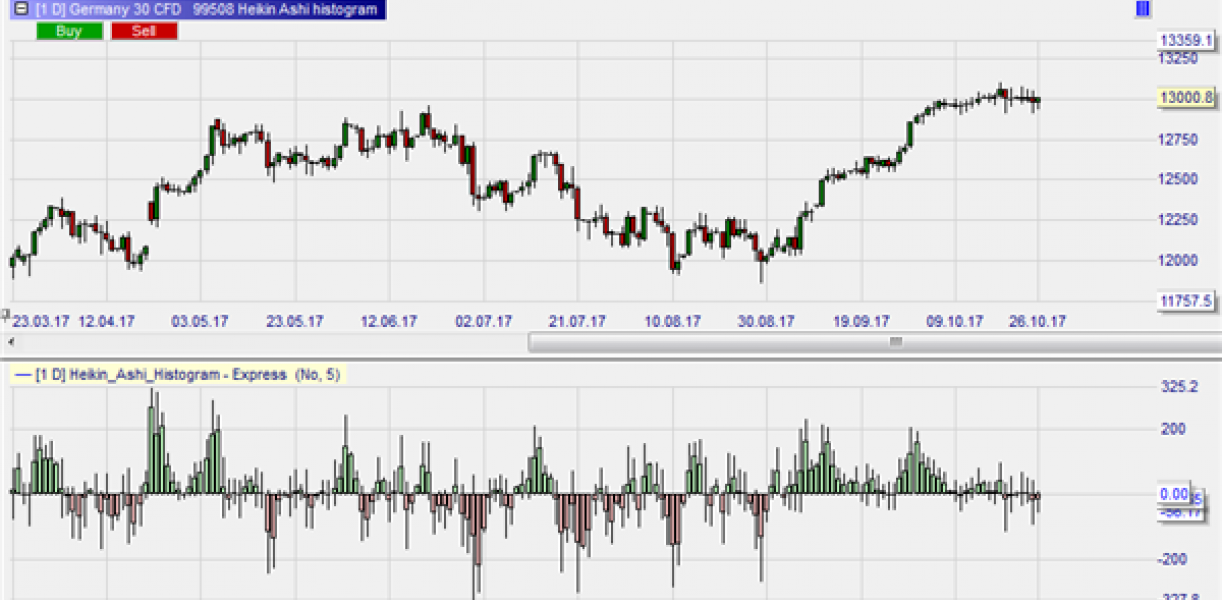
Traders can use the Heikin Ashi Histogram to fine tune trading signals. The tool (shown here in the TwinChart) makes overbought and oversold zones clearly visible. If, in an upwards trend, the Heikin Ashi histogram chances from red to green, this may indicate a return to the main upwards trend.
These are the advantages of the Heikin Ashi histogram:
- Visualises overbought and oversold zones.
- Provides precise buy and short sell signals.
- Indicates when the trend weakens.
- Warns in advance when momentum starts to run out of steam.
- Provides a clear exit signal when the colour of the candles changes.
- Allows the interesting combination of classic candlesticks and Heikin Ashi candlesticks.
- Works in all time frames and in all markets.
USING THE HEIKIN ASHI HISTOGRAM WHEN TRADING
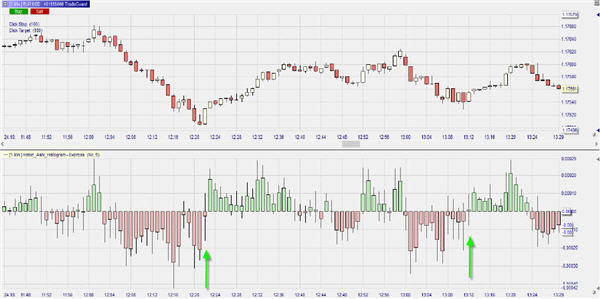
The combination of a 1-minute chart and the Heikin Ashi histogram allows the scalper and the day trader to identify precise signals, in this example, on the EUR/USD. The change of colour in the histogram indicates a change in sentiment from bullish to bearish or vice versa. However, each colour change is not to be interpreted as a signal. The above example contains several signals which the trader should ignore. As a rule of thumb it can be said that signals after prolonged periods of the same colour in the histogram are more reliable than signals which occur after only two or three candles.
Even more interesting to traders should be histogram turning points which coincide with chart patterns such as Dojis or Spinning Tops (see green arrows in the example above). These patterns are also indicators of an even balance between buyers and sellers, indicating a potential mood change.
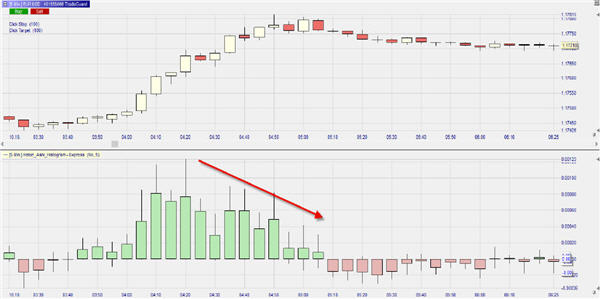
The above 5-minute EUR/USD chart shows another advantage of the Heikin Ashi Histogram. The market rises sharply. This is clearly indicated by the growing green Heikin Ashi candles. After the eight Heikin Ashi candle, however, the size of the candles retracts (see red arrow) even though the market continues to go up. This divergence is a first indicator that the upwards trend is weakening. At this stage a trader with a long position should consider securing his profits. He can slide his stop upwards or convert a fixed stop into a trailing stop. This can be done in one click on the NanoTrader. A trader who only uses the classic candlesticks would not have seen what was happening in the market.
A UNIVERSAL TOOL
In general it can be said that a switch around the zero line in the histogram constitutes a change in mood from long to short or vice versa. This phenomenon alone does not constitute a trading signal. The histogram should be used in conjunction with other easy-to-use weapons from the trader's technical analysis arsenal. Likely candidates are support and resistance levels, highs and lows of the previous day(s) and some chart patterns. The evolution of the size of the Heikin Ashi candles making up the histogram also contains good clues for the trader.
The Heikin Ashi histogram is an universal tool. It can be used for all markets and in all time frames.
Try the Heikin Ashi histogram... download the NanoTrader demo.
"I really appreciate, as do many of your clients I suppose, the fact that the NanoTrader never stops evolving."
– V.F.

Free demo

Trading videos
Charting, strategies, automated trading, backtesting, playback... watch these videos and become a platform master.

Broker
WH SelfInvest serves traders from offices in Germany, France, Switzerland, Belgium, Luxemburg and the Netherlands.
The spectacular SignalRadar
SignalRadar shows live trades being executed by various trading strategies.
More ...
- ‹ previous
- 3 of 5
- next ›