Test NanoTrader Full I Test Tradingview I Test the mobile platforms All for CFD-Forex & Futures
You are here
Trades à la carte
TechScan is a technical analysis tool. It is seamlessly integrated in the NanoTrader and analyses more than 10 stock markets, 130 forex pairs and 15 market indices every day. These markets and instruments are analysed using over 100 technical analysis indicators, statistical data and trading strategies.
These are the advantages of the TechScan tool:
- Instinctive to use.
- Beautiful and extensive charts and graphics.
- Covers the full technical analysis domain by using technical indicators, statistics and strategies.
- The number of instruments analysed is vast.
- Includes tools for pairs trading and market outperformance.
- It is free.
- No programming required.
Download a free real-time demo of the NanoTrader Full trading platform
TechScan scans more than 10 stock markets (Germany, France, US, Belgium, Netherlands ...), more than 130 forex pairs (EUR/USD, EUR/GBP, ...) and more than 15 market indices (DAX, CAC, Dow ...). Each new signal is illustrated with a beautiful chart showing the signal. All buy and short sell signals are saved for each financial instrument so you can see if there is an increase in signals.
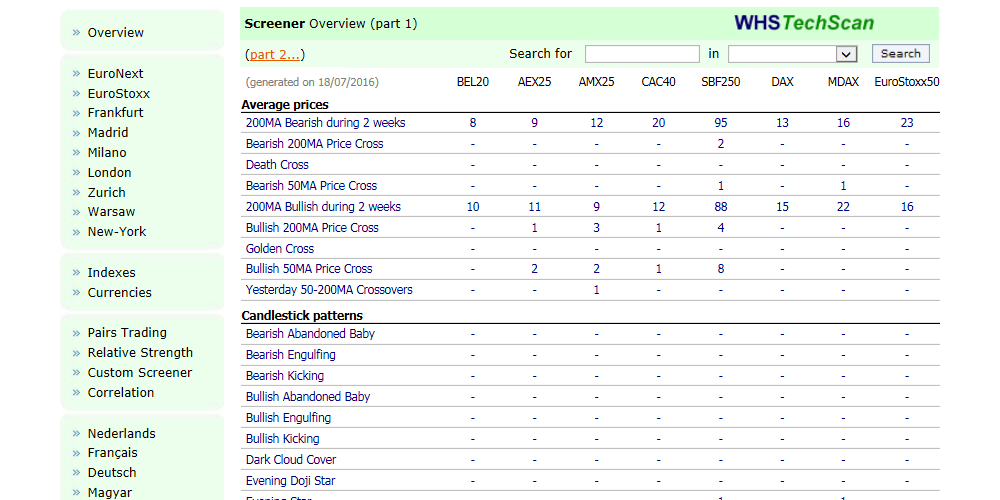
1. TRADING SIGNALS A LA CARTE
In addition to forex pairs and market indices, TechScan currently analyses stocks from these markets: U.S., Germany, France, Belgium, Netherlands, Switzerland, Poland, U.K., Spain and Italy.
The results of TechScan’s overnight analysis are displayed in the quick overview table which you can see above. For each stock, forex pair and market index TechScan provides a detailed analysis including a history of previous buy and sell signals.
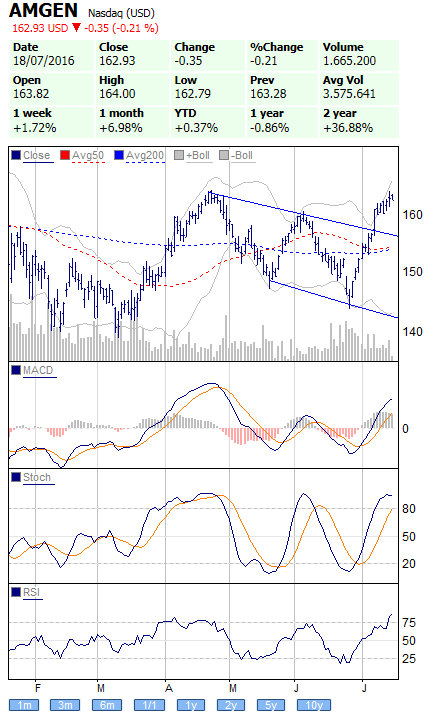
This example shows the stock Amgen which is part of the S&P 500 index.
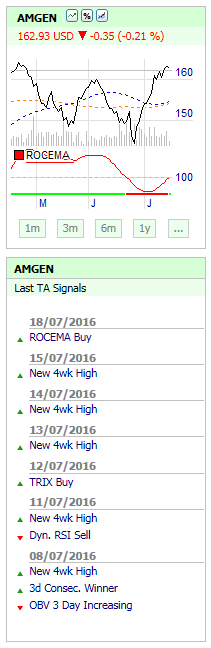
By clicking on the small icons the trader can get an even more detailed analysis.
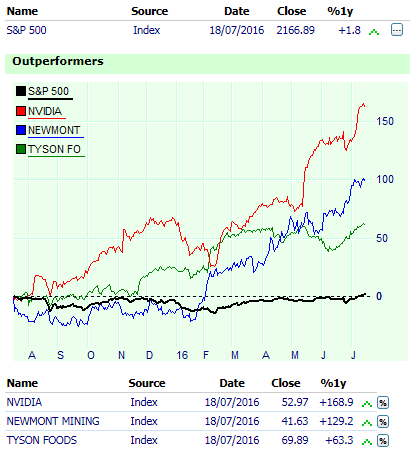
2. A GOOD PERFORMANCE?
Traders are always interested in stocks which outperform or underperform their index. TechScan provides this information. Traders can set their own horizons.
This example shows the three stocks which outperformed the S&P 500 index the most over the last year.
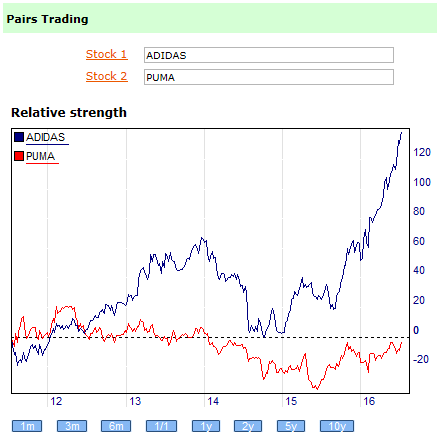
3. PAIRS TRADING
TechScan indicates the correlation percentage between one stock and another or between a stock and an index. The tool will indicate which stocks are closely correlated or traders can select their own pairs.
This example shows the relative strength of the stocks Adidas and Puma over the last 10 years.
TechScan is an amazing free tool which identifies on a daily basis swing and day trading opportunities for traders and active investors.
Discover TechScan... free real-time demo of the NanoTrader Full trading platform
Free demo

Trading videos
Charting, strategies, automated trading, backtesting, playback... watch these videos and become a platform master.

Broker
WH SelfInvest serves traders from offices in Germany, France, Switzerland, Belgium, Luxemburg and the Netherlands.
The spectacular SignalRadar
SignalRadar shows live trades being executed by various trading strategies.
More ...
- ‹ previous
- 3 of 5
- next ›