You are here

Andrews pitchfork, drawing the pitchfork correctly

Most traders are familiar with the Andrews Pitchfork drawing tool. The distinctive pitchfork shape definitely attracts the eye. In spite of being very recognisable few traders can draw Andrews pitchfork correctly. This article suggests one solution to draw a usable Andrews Pitchfork.


THREE POINTS

The trader drawing Andrews Pitchfork needs to determine three points. By adding the RSI technical indicator below the chart, it can be used to determine the three points. Select the three most extreme last high and low points of the RSI. The combination to draw needs to be either low-high-low or high-low-high.

This example shows the combination low-high-low taken from the RSI indicator below the chart. This results in an Andrews Pitchfork with a slightly bullish trend.
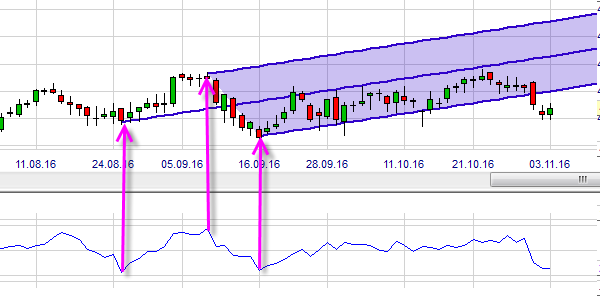
Using the RSI technical analysis indicator to draw a correct Andrews Pitchfork.

TIP: EXTEND THE FUTURE

In trading the Andrews Pitchfork is used in various ways. All evolve around the concepts of the market price moving within the band, returning to the central line or breaking out. In all cases it is useful for the trader to see his Andrews Pitchfork well extended into the future. This also allows him to see where support and resistance levels based on the chart, intersect with the Andrews Pitchfork.

The NanoTrader allows you to set the percentage of your chart which is dedicated to the future. This is extremely useful for traders working with drawing tools.

This example shows a trader with 10% of his chart dedicated to the future. This is typical for most trading platforms and cannot be changed usually. For a drawing tool like Andrews Pitchfork which extends into the future, this is not optimal.
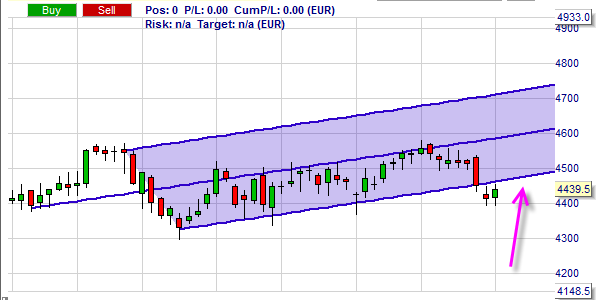
Trading based on the Andrews Pitchfork. Drawing the pitchfork correctly.

This example shows a trader which set 33% as the part of his chart dedicated to the future. Suddenly the visibility improves.
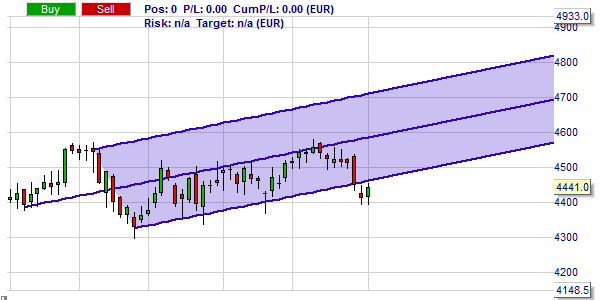
Andrews pitchfork in the NanoTrader with an extended chart.


Download a free real-time demo of the NanoTrader Full trading platform


Free demo

Test NanoTrader Full  I  Test Tradingview  I  Test the mobile platforms  All for CFD-Forex & Futures

Buy US stocks

Pay 0,00 $ order commissions with Freestoxx

Trading videos

Charting, strategies, automated trading, backtesting, playback... watch these videos and become a platform master.

Managed account

+33,1% (2020) & +17,5% (2021). Explore Investui

Broker

WH SelfInvest serves traders from offices in GermanyFranceSwitzerlandBelgiumLuxemburg and the Netherlands.

The spectacular SignalRadar

SignalRadar shows live trades being executed by various trading strategies.

CFDs are complex instruments and come with a high risk of losing money rapidly due to leverage. 78% of retail investor accounts lose money when trading CFDs with this provider. You should consider whether you understand how CFDs work and whether you can afford to take the high risk of losing your money.


Futures are complex instruments subject to unpredictable changes in price. They are financial instruments which offer the investor the possibility to use leverage. The use of leverage implies the risk of losing more than the total value of the account.


Investments in digital assets are considered highly speculative investments and are subject to high volatility and therefore may not be suitable for all investors. Each investor should consider carefully, and possibly with external advice, whether digital assets are suitable for them. Make sure you understand any digital asset before you trade it.


Back tested and real past performance do not guarantee future performance. Every investor should make sure, if possible with the help of an advisor, if the Investui service is suitable for his personal situation. All investments carry significant risk. There is no guarantee of profit.


Copyright 2024. WH SelfInvest, 33 rue du Puits Romain, 2nd Floor, 8070 Luxembourg-Bertrange, Luxembourg


Back to Top