Test NanoTrader Full I Test Tradingview I Test the mobile platforms All for CFD-Forex & Futures
You are here
Trading volatility in an intelligent manner
Traders often struggle with how to define, measure, and use volatility in their trading strategies. This section of the website explains how you can visualise and integrate volatility in your trading strategies. As an example a volatility trading strategy is shown for the Dow Jones market index.
As usual, absolutely no programming is required in the NanoTrader.
The trading examples in this section use futures. If you are interested in an outstanding futures broker, consider WH SelfInvest.

HOW YOU CAN TRADE VOLATILITY
1. USEFUL VOLATILITY INDICATORS
First things, first. To measure volatility use the ATR. It is the most effective volatility indicator. ATR stands for "Average True Range". Basically, volatility is equal to the price ranges over a day. The True Range takes into account the price differences over two days by selecting the largest of the following three values: (1) range between high and low prices, (2) range between previous closing price and high price, and (3) range between previous closing price and low price. The ATR is the average of the True Range over a given period of time. It can be expressed as a number of ticks, points or a percentage
In the NanoTrader platform, there are different indicators built from the ATR. In any case, here are my favorite volatility indicators:
a. VOLATILITY
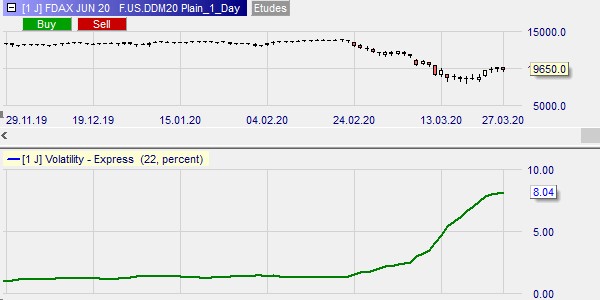
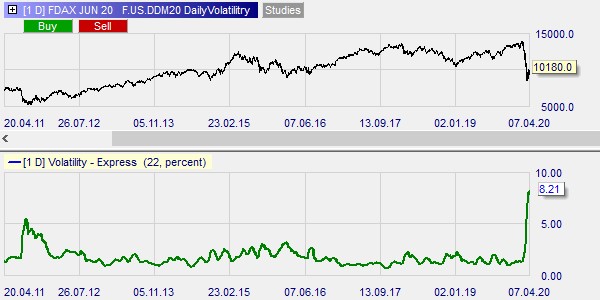
This indicator displays the ATR curve as a percentage over a given period of time. In this example of a daily chart on the future Dax, the Volatility indicator shows the volatility in percent over 22 days (about 4 weeks).
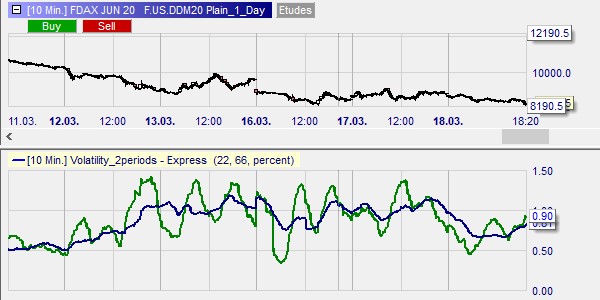
b. VOLATILITY_2PERIODS
This indicator allows the comparison of ATR curves over two different time periods. In this example of a daily chart on the future Dax, the indicator Volatility_2periods shows a green volatility curve over 22 days and a blue volatility curve over 66 days. The areas of high volatility correspond to the periods in which the green curve is above the blue curve and vice versa.
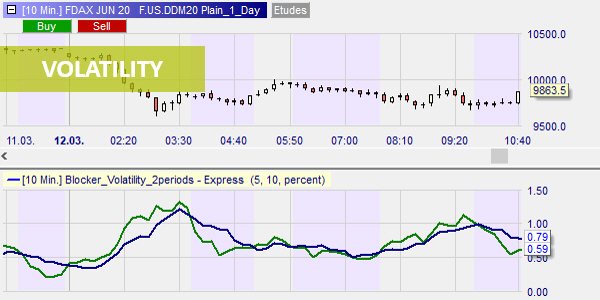
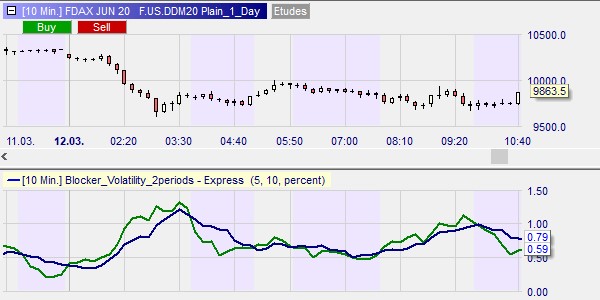
c. BLOCKER_VOLATILITY_2PERIODS
This blocker is a variation of the Volatility_2periods indicator. It is placed in the Filters section of the Designer Bar. It allows you to block transactions when volatility is low, i.e. when the green volatility curve over 5 periods is lower than the blue volatility curve over 10 periods.
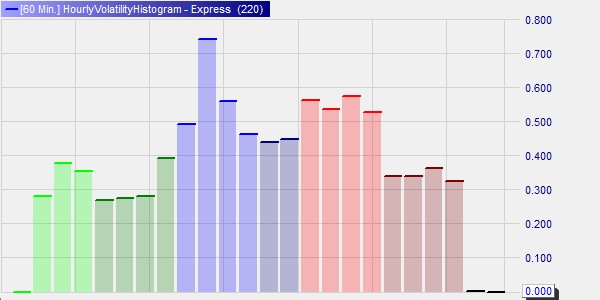
d. HOURLY VOLATILITY HISTOGRAM
This indicator represents the average hourly volatility over a period of 220 days of the future Dax. The vertical scale represents the percentage volatility. The bars start from left to right from 0:00 to 23:00 (Luxembourg time). For example, the blue bars represent the period from 8:00 a.m. to 12:00 p.m. and the red bars from 2:00 p.m. to 6:00 p.m. It is used to search for the most volatile time slots.
In this example of the DAX future, we see that the most volatile hour of the day is from 9 to 10 am.
In conclusion, these volatility indicators are very useful because they allow traders to always be aware of the current level of volatility, in absolute terms but also relative to historical volatility.
2. LET'S TAKE A LOOK AT THE DAX MARKET INDEX
Many traders remember the volatility of 2011. We were in the middle of the Greek debt crisis. That year, the average daily volatility of the future Dax over 22 days reached a record high of 5,5%. For about a month, the future Dax, which was worth about 6.000 points, made daily ups and downs of about 330 points or 8.250 Euro (note: one point on the DAX future is worth 25 Euro).
As can be seen on this chart the average daily volatility of the DAX future over 22 days during the "Corona-crash" reached a record level of 8.21%, i.e. daily variations of around 20.894 Euro. This new volatility record over 10 years beats the previous record by 50%!
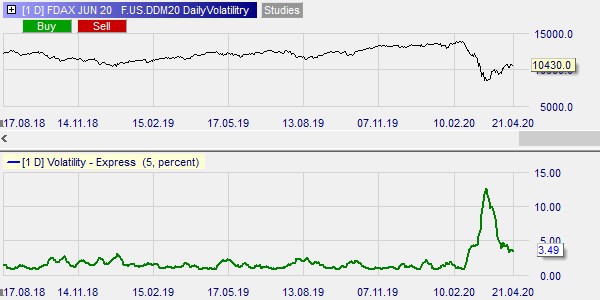
This sudden sharp rise in volatility is already a thing of the past and we are now operating in an environment of very favourable volatility for active short-term trading. Indeed, after reaching a high of 12,5%, the average daily volatility of the future Dax over 5 days has fallen to 3,5%. This level of volatility is twice as high as the volatility we have known for about the last 3 years.
Thanks to high, but not extreme, volatility, short-term traders can exploit the movements in day trading with, for example, Black Candle type strategies and in scalping with the D&D Range Bar Scalping strategy.
3. TRADE DOW JONES INDEX VOLATILITY WITH THE BLACK CANDELS
Now that volatility is back in the global equity markets, the opportunity is there to apply one of the fundamental principles of trading, that of trading in the direction of the trend. We will see how this principle can be applied to the Dow Jones and how effective it can be through the analysis of a few trades.
To begin with, we will choose two essential tools for this type of strategy: a signal and a trend indicator. For the signal, we opt for the Black Candle signal which is a derivative of the very popular Heikin Ashi chart. To detect the trend, we will rely on an indicator not yet mentioned in this section, the Parabolic SAR.
We then select the instrument on which we wish to trade: the Mini-Dow future (note: one point of which represents a value of $ 5). Let's now move on to the quick and easy implementation of our strategy in the NanoTrader platform. As usual no programming is required in the NanoTrader.
Detecting the trend
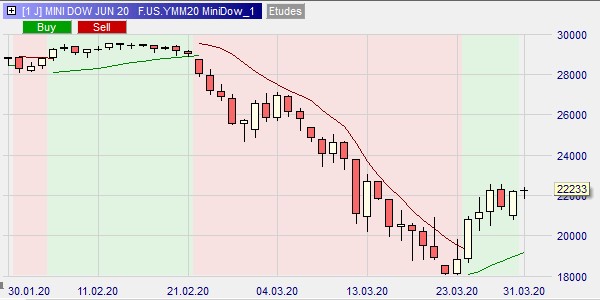
First, we detect the trend. In a candlestick chart of daytime aggregation containing the future Mini Dow, we enter the MetaSentimentor indicator which we accompany with two Parabolic SARs, the first as an indicator and the second as a filter. The result is a study we call MiniDow_1 illustrated below.
Setting up the signal
Then we set up the signal. In a 1-minute candlestick chart containing the future Mini Dow, we enter the following five components: (1) The Study indicator, which imports the MetaSentimentor from the MiniDow_1 study and gives the periods of upward and downward trends. This is a structuring element of our strategy. Only signals oriented in the direction of the main trend will be executed. Other signals will simply be ignored. We then enter (2) the Black Candles signal, (3) the STP Black Candles trailing stop, (4) the TGT Black Candles trailing target and (5) a Flat filter to close any positions at 22:10. We do not want to hold positions overnight as we practice Day Trading. As one can see, the number of components is relatively limited. This is only possible because each of these components is an element with high added value. All that remains to be decided is the time frame. We have selected 15:15 - 18:00.
Activating the strategy in automatic mode
Our strategy is ready to be activated. We select the AutoOrder mode, which allows us to systematically automate position entry, position management and position exit. That is to say, a complete automation of the strategy. The opening of a position will be triggered with market price orders sent by the NanoTrader platform when signals oriented in the direction of the trend appear. Stop and target orders are hosted on the market servers. We are therefore secure.
Outcome of the strategy
As is usual in trading, we lose and we win. In our case, at the time of writing this article, the strategy has a winning open position of USD 1570 which covers the loss of USD 205 conceded earlier. The screen of the NanoTrader platform appears like this.
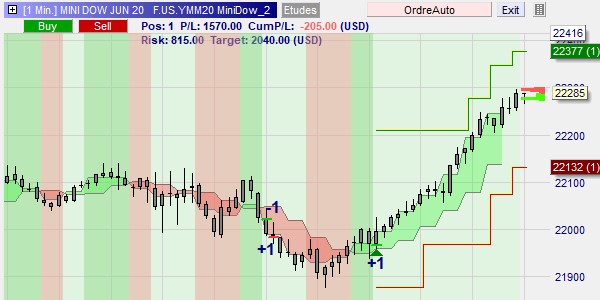
The following elements can be recognized:
• Black candles are characteristic of the Black Candle strategy. They are black because our attention should really be focused on the red and green bands.
• These bands represent the body of the Heikin Ashi 3x aggregation candles.
• The signal is defined by 2x3=6 candles of bearish trend, marked with a red background, followed by 1x3=3 candles of bullish trend, marked with a green background.
• We see a first losing trade open at the green line +1 quickly closed at the red line -1. Fortunately, the stop is thoughtfully placed on the previous low which allowed us to lose little.
• We then see a second trade open at the second green line +1.
• This position is protected by a trailing stop which is positioned on the previous lowest. The risk is defined by the difference between the entry price and the initial stop. As soon as the price has closed more than once the risk, the stop is raised to the level of the entry price. We can no longer lose on the position.
• Then the price experienced a bullish rally with a stop that followed in half, reducing the risk to USD 815. At the same time, the target moved elegantly away so as not to hinder the price rise. These thoughtful tracking properties of our stop and target allow us in many situations to increase profit per trade.
• At this stage, we win USD 1570 with a loss of USD 205. If we don't make any more trades, we are sure to end the day with a profit of at least USD 610 (815 - 205). On the other hand, we can't know the maximum profit because depending on the circumstances, the position could gain more without being closed, one of the great advantages of this strategy!
In conclusion, here is an ideal strategy for day trading in the volatile environment we are now experiencing.
Free demo

Trading videos
Charting, strategies, automated trading, backtesting, playback... watch these videos and become a platform master.

Broker
WH SelfInvest serves traders from offices in Germany, France, Switzerland, Belgium, Luxemburg and the Netherlands.
The spectacular SignalRadar
SignalRadar shows live trades being executed by various trading strategies.
More ...
- 1 of 5
- next ›