Test NanoTrader Full I Test Tradingview I Test the mobile platforms All for CFD-Forex & Futures
You are here
Scalping crude oil
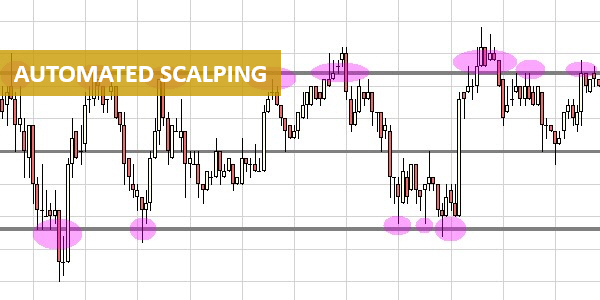
US Crude Oil, also known as WTI (West Texas Intermediate), is an interesting financial instrument to trade for scalpers. It has two very favourable characteristics for scalping. Firstly, its volatility is high compared to that of market indices. Secondly, there are frequent periods during which oil moves in a range, i.e. within a relatively stable price interval. With the help of the new SNIPER indicator, scalpers can detect these ranges and exploit the back and forth movements that occur within these ranges.
This section illustrates the high level of volatility in the US Crude Oil market. The SNIPER indicator gives traders and scalpers a strong competitive advantage. It allows them to profit from range-bound price movements.
Everything scalpers need to replicate this strategy is available for FREE in the NanoTrader trading platform.
A scalper's paradise?
US Crude Oil is 67% more volatile than the German market index DAX
For short-term traders, US Crude Oil can be traded through the CME-NYMEX Crude Oil future (Chicago Mercantile Exchange - New York Mercantile Exchange ) or equivalent CFDs. In the NanoTrader platform, the free Hourly Volatility Histogram indicator gives an instant analysis of the hourly volatility over a 240 day period. We can see below that the most volatile hours for the Crude Oil future are between 3pm and 6pm. The maximum hourly volatility is then 1.14%, which is 67% higher than the maximum hourly volatility of the Dax future at 0.68%. This higher volatility is an advantage for scalpers because the greater the amplitude of a price movement, the more opportunities there are to capture part of that movement.
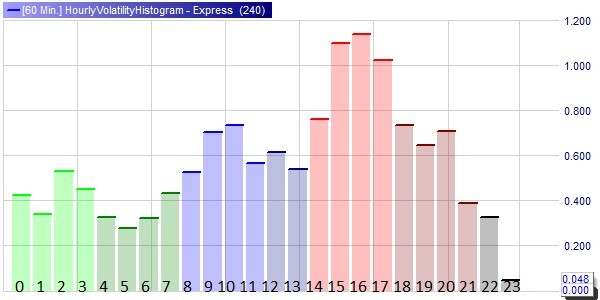
An interesting fact is that the Crude Oil future offers a volatility close to the maximum hourly volatility level of the Dax future during 9 hours when European traders are available: from 9:00 to 15:00 and from 18:00 to 21:00. During these periods, the Crude Oil future often moves within stable price ranges, which favours range trading.
The SNIPER indicator detects price ranges
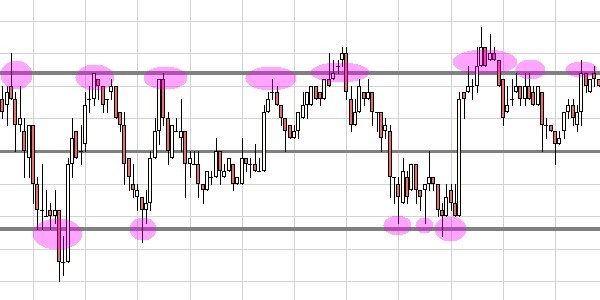
The SNIPER indicator analyses the main trends by highlighting major support and resistance lines. A support line corresponds to a price level at which the market tends to bounce upwards, while a resistance line corresponds to a price level at which the market tends to bounce downwards.
The example below shows the typical case of a range in which the upper and lower grey lines, drawn by the SNIPER indicator, represent the resistance line and the support line respectively. These lines are there because they have behaved as supports or resistances in the past. They carry with them the memory of the past. A range can last for a short or long time, but certainly not forever. One of the reasons why range scalping is attractive is that when the market moves into a range, it is more likely to stay there than to move out. This is an important property that we try to exploit in the following.
Detecting a price range early
To practice range scalping, we operate in a 1-minute aggregation candlestick chart in which we load the SNIPER indicator with a Line_precision parameter of 10 ticks on the Crude Oil future (note: One tick is 0.01 points. The minimum distance between two SNIPER lines is 0.10 points (= 10 x 0.01). If we work with another instrument, we have to adapt this parameter according to the value of the tick.
The first step in tackling this form of scalping is to learn to spot the configuration below.
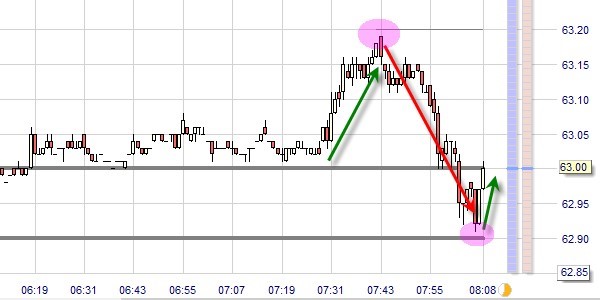
We observe that the Crude Oil future had a quiet night as it was almost constant around $63.00. Then at around 7:30am CET (Paris, Frankfurt, Brussels time) , the market first rose before being rejected at $63.20 at around 7:43am. This rejection led to the appearance of a SNIPER line which attests to the presence of a resistance at $63.20. At around 8:05am, the price, which had been falling, bounced off a support at $62.90.
At this stage, a configuration based on the following elements can be recognised:
- A quiet market
- A push up to $63.20 resistance
- A rejection at $63.20 followed by a drop to $62.90
- A rejection at $62.90 followed by the beginning of a price rise.
At this point, it is reasonable to bet that the market may have entered a range defined by the $62.90 and $63.20 levels.
A scalping strategy for a crude oil price range
Keep it simple. When the market appears to be moving within a range, the easiest strategy to employ is to sell at the top of the range and buy at the bottom of the range.
In the previous example, we set ourselves to TradeGuard + AutoOrder mode to enter a position manually and be automatically protected by a pair of fixed stop and target orders.
We then bought at the bottom of the range and protected our position with a stop order and a limit order at 20 ticks (note: 20 ticks = 0.20 points = $200). These orders can be quickly moved with a few clicks to protect against a large loss: we move our stop up to the bottom of the range and lower our target to increase our chances of a winning exit. At around 8:31am, seeing that our target might not be hit, we exited at the market price and took a profit of $110.
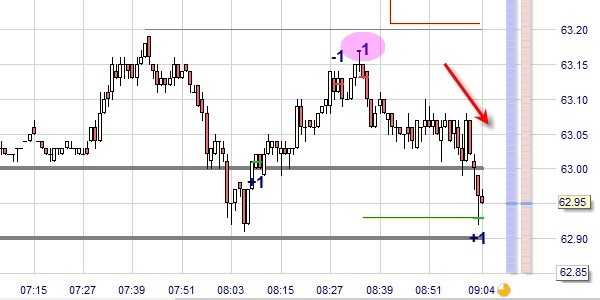
Our assumption is that the market is still in the range and the highest probability is that it will stay in the range. So, we continue to apply this strategy by going short. The stop is quickly positioned at the top of the range. Finally, the market hits our target at the bottom of the range for a profit of $200.
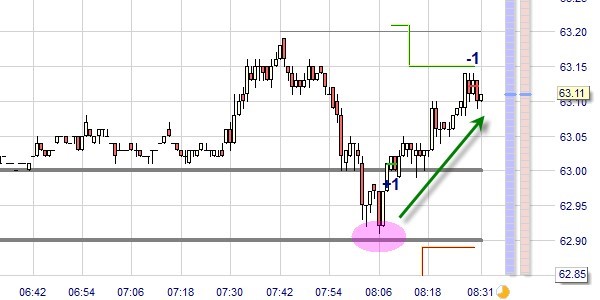
This scalping strategy can continue to be applied as long as the market moves within the range. Of course, after a while the market will break out of the range and the question will be to what level and also, will it enter a new range?
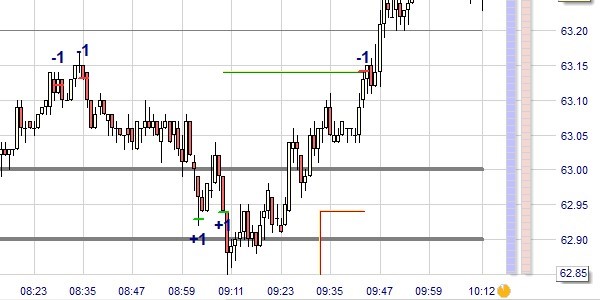
In our example, the market rebounded again, producing a profit of $200.
Then, the market finally broke out of the range before being pushed back by the resistance of $63.40.
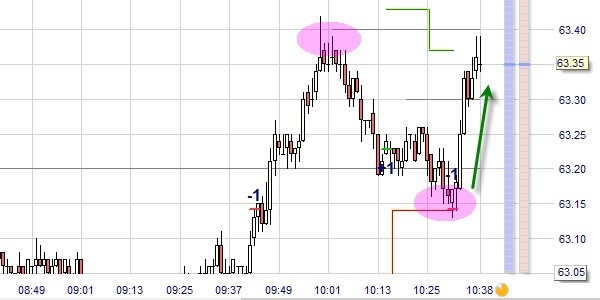
A classic feature of support and resistance line strategies is that resistance often turns into support. This is what happened in our example, where the market, which was going down after reaching $63.40, bounced off the $63.20 support. We tried to take advantage of this by buying on the first bounce, but unfortunately, we were stopped out because we had raised our stop too high and it was hit. You can't win every time!
Suitable instruments for trading WTI Crude Oil
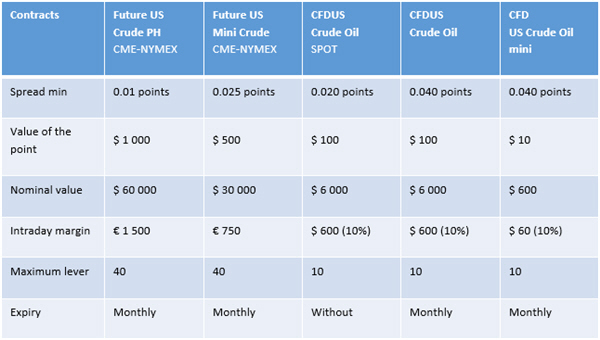
US Crude Oil can be traded through two classes of financial instruments: futures and CFD contracts. WH SelfInvest offers access, with real-time tick-by-tick quotes (note: do not trade futures if you do not have tick-by-tick quotes) to the Crude Oil and Mini Crude Oil futures contracts offered by CME-NYMEX . Broker WH SelfInvest also offers three US Crude Oil CFD contracts. These CFD contracts are smaller than the futures contracts as can be seen in the table of their characteristics below.
Conclusions on crude oil scalping
US Crude Oil, well known as WTI, is tradable through various futures and CFD instruments. The Crude Oil future is interesting for scalpers because it offers about 67% higher volatility than the Dax future. In addition, the Crude Oil future lends itself well to range scalping strategies. To spot ranges, the NanoTrader platform offers a powerful indicator, SNIPER, which allows to draw major support and resistance lines. Once the SNIPER lines are displayed, the scalper can more easily detect the relevant ranges and apply a range scalping strategy. Aided by the SNIPER lines, the scalper can engage in low risk, high probability trades.
Recommended broker
People also read
- The support and resistance Sniper
- Scalping trading ranges with the new Sniper
- A DAX and DOW scalping strategy
Recommended managed account service


