Test NanoTrader Full I Test Tradingview I Test the mobile platforms All for CFD-Forex & Futures
You are here
Making volatility visible
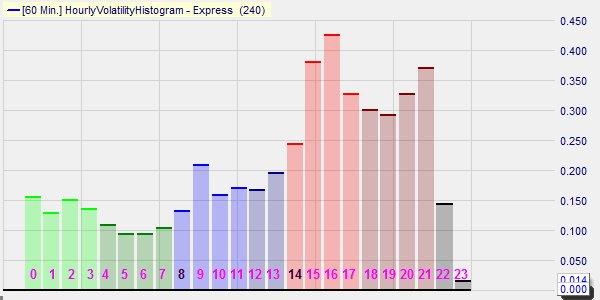
What is the best time to trade? The HVH (Hourly Volatility Histogram) provides the answer by calculating the hourly volatility for each market. The most volatile times of the day, are the most interesting for traders. When markets move, opportunities arise. Using the HVH tool traders can literally see when a market is volatile and how its volatility compares to the volatility of other markets.
These are the advantages of the HVH tool:
- Indicates the best time to trade.
- Shows you the size of the volatility.
- Can be used on every instrument.
- Easy to use and easy to interpret.
- It is FREE.
1. HOW TO INTERPRET THE HVH
The 24 bars of the histogram correspond to the 24 hours in a day. Each bar represents an hour from 0 (0:00-0:59) to 23 (23:00-23:59). The blue colours are the main European hours, starting at 8:00. The red colours are the main US hours, starting at 14:00.
The performance of a trader depends, among other things, on his capacity to spot the best moments to trade. A good tool, which visualises the time and the size of the volatility, is therefore crucial. Volatility changes over time. Many novice traders ignore this essential fact. When volatility drops in one market, good traders change to another market. Most strategies require a minimum degree of volatility in order to be successful. One rare exception to this rule is the MAD Rebound strategy, which appears to thrive in markets going sideways with limited volatility.
2. A FEW EXAMPLES
Example 1: the DAX CFD. Free platform demo
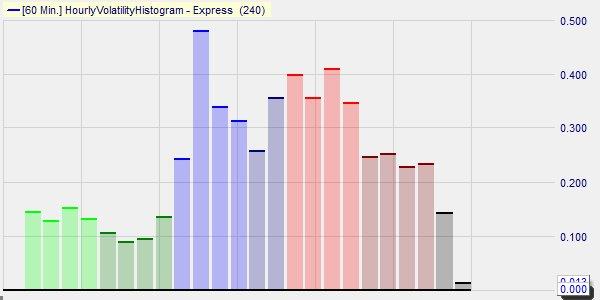
This HVH example shows the German DAX market index.The blue blocks correspond to the main European trading hours. The red blocks correspond to the main U.S. trading hours. It is clear that the DAX is at its most volatile in the second hour (9h00 to 10h00). In this example the volatility in the second hour was 0,48 %. After 10.00 o'clock the trader must be satisfied with less volatility (0,35% in this case).
Example 2: the DOW CFD. Free platform demo
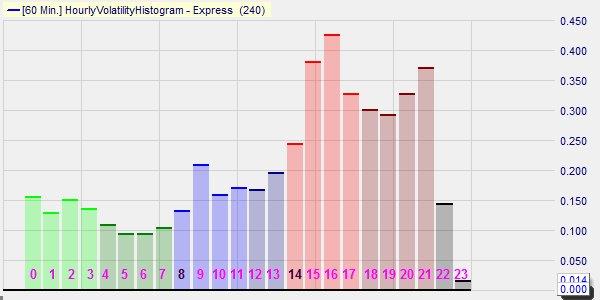
This HVH example shows the DOW market index. The two most volatile hours are the 15th hour (15h00-15h59) and the 16th hour (16h00-16h59). The hourly volatility during these hours is 0,38% en 0,43% respectively. When the DOW quotes, for example, 24 000 this implies that the DOW moves on average 103 points during the 16th hour. Notice that currently the DOW is more volatile than the DAX, with three hours during which the volatility exceeds 0,40%.
Example 3: Apple (AAPL). Free platform demo
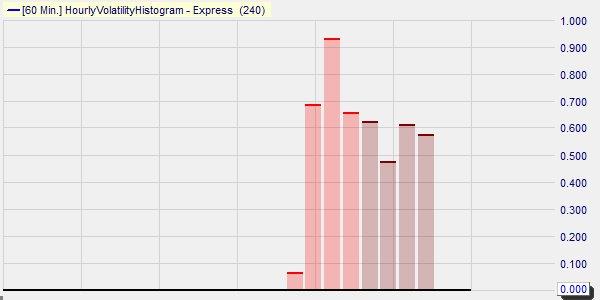
This HVH example shows the Apple stock (ticker AAPL). Apple does not trade 24 hours per day. Hence only eight blocks are shown. These blocks corresponds to the U.S. stock market hours. The first block is the 14th hour (14h00-14h59), which includes the pre-market.
Some feedback from traders using the NanoTrader via Broker WH SelfInvest:
NanoTrader is my fourth and by far the best trading platform. – H.B.
It is incredible what your trading platform can do. – N.R.
NanoTrader is a reliable and robust trading platform. – C.U.
The NanoTrader leaves no desire unmet. – W.G.
Explore the HVH... download a free platform demo.
- Tip: the HVH is located in the WHS Proposals folder in NanoTrader.


