Test NanoTrader Full I Test Tradingview I Test the mobile platforms All for CFD-Forex & Futures
You are here
3x unique: The Black Candles strategy
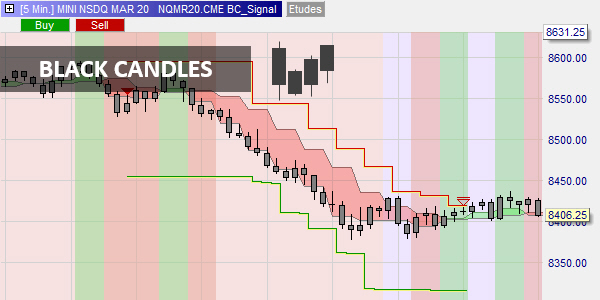
Another free trading strategy containing 3 unique components has been added to the NanoTrader platform. The Black Candles strategy contains a unique trading channel. The channel is based on the popular Heikin Ashi candles. It is capable of detecting the first stage of a new trend. Also sensational is the fact that the charts combine this channel with regular candles but in a small time frame. This ensures a better quality trading signal whilst still allowing the trader to see all market action. The colour of the candles is not relevant. Therefore, they are black.
The Black Candles strategy in a nutshell:
- A unique channel based on Heikin Ashi candles.
- The channel and the standard candles are in the same chart BUT in a different time frame. Traders can see the action AND have better signals based on a higher time frame.
- The SuperTrend indicator filters the trading signals.
- The profit is maximized with the unique trailing targets.
- The Black Candles strategy can be used for day trading and swing trading.
1. THE BLACK CANDLES STRATEGY
This example shows the trading channel and the black candles. The red line is the SuperTrend indicator. Its position, above the chart, and its colour, red, indicate the market is bearish.
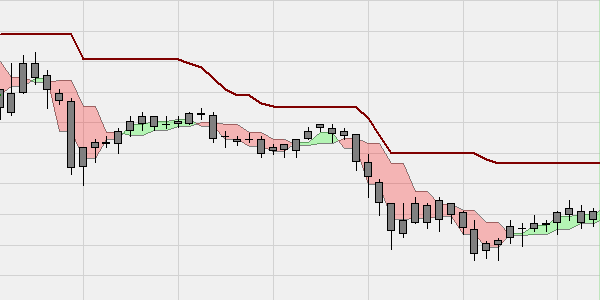
Equally unique is the fact that the channel and the standard candles are not in the same time-frame but … they are visible in the same chart. This is called an aggregation. Say, the trader sets the aggregation to 2 and the time frame of his chart to 10 minutes. In this case, the black candles are 10-minute candles and the channel is based on invisible 20-minute Heikin Ashi candles.
Traders can set their black candles in a small time frame, for example 5 minutes, and see the market action. At the same time, they can set the aggregation to, for example, 6 so the channel, which gives the signals, is based on 30-minute invisible Heikin Ashi candles. As always in trading, increasing the time frame reduces the number of trading signals but increases the quality of the signals.
Read when to open a position and when to close a position for the full details on how this strategy is traded.
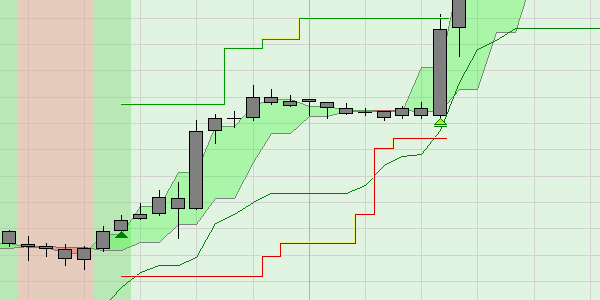
The oositions are very well protected. Both the target and the stop are based on the current volatility of the market. The trailing target is unique. This sensational tool automatically changes the profit target. If the tool detects a strong market, it will (continue) to increase the profit target in an attempt to maximize the trader’s profit. This example shows a buy signal. Notice how the trailing target moves up to maximize profit when the market goes up significantly.
2. TRADING IN VOLATILE MARKETS
With the return of volatility in the markets, one might ask what strategies are capable of thriving in this environment? Black Candle strategies come immediately to mind because they adapt quickly to any environment.
2.a. GO WITH THE FLOW
First of all, Black Candle strategies are based on a principle that generally pays off in periods of high volatility: trading with the trend.
Second, they use a trend reversal signal to exploit rebounds in the direction of the trend.
Finally, they use a stop and target system that can move in tandem to capture large movements.
2.b. THE MINI NASDAQ 100 FUTURE
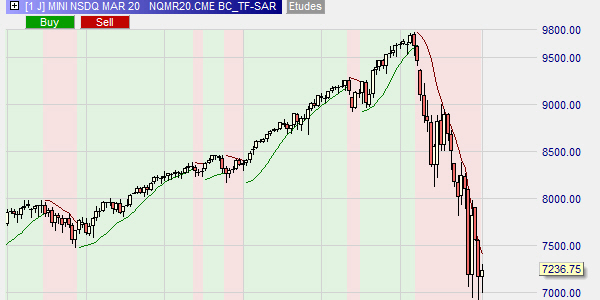
To discover Black Candle strategies, we will now analyze an example of application on one of the stars of the Chicago Mercantile Exchange, the Mini Nasdaq future. The first step is to construct Study 1 below, which aims to analyse the main trend. It uses the Parabolic SAR indicator in a daily graph. Two phases can be clearly distinguished. The first is characterized by a steady rise in the market and is accompanied by low volatility. The second is characterized by a rapid fall in the market and is accompanied by impressive volatility.
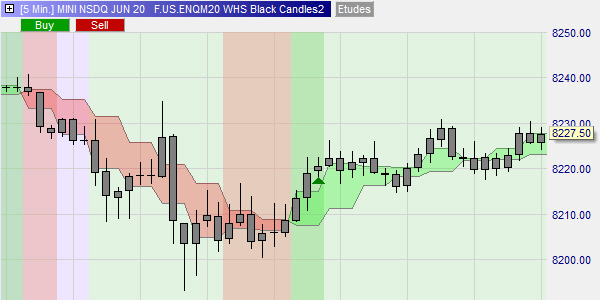
The second step is to build a study 2 from which the trades will be generated. Built within a 5-minute chart, it is composed of the following elements:
- The main trend defined in Study 1 is imported to filter the signals and colour the background (green = increase, red = decrease).
- The secondary trend is represented by green (bullish) or red (bearish) bands.
- The Black Candle signal is based on secondary trend reversals. In order to have rarer and more relevant signals, the bands below are aggregated by a factor of 3.
- The Black Candle signal is additionally defined by the number of candles of the old trend and the number of candles of the new trend. Below, the aggregation is 3, the number of candles of the old trend is 2 and the number of candles of the new trend is 1. This gives 6 candles (2 x 3) of the old trend + 3 candles (1 x 3) of the new trend.
- The signal occurs at the closing of the 9th candle and is identified by the green triangle.
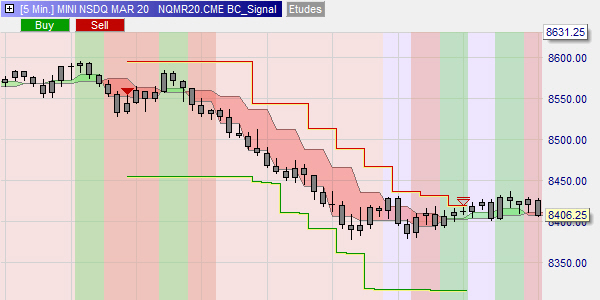
- The Black Candle signal is associated with a truly unique stop/target system in that both the stop and the target are able to automatically follow profitable price moves.
- In the example below, a short position has been taken. A fixed stop is placed on the previous high and a target is placed at a fixed distance from the entry price. Then, when the price has exceeded the initial target, the stop is lowered to the level of the entry price so that one cannot lose any more. The stop and the target followed the price down until the price hit the stop. This mobility of the stop and the target increases the gain/loss ratio.
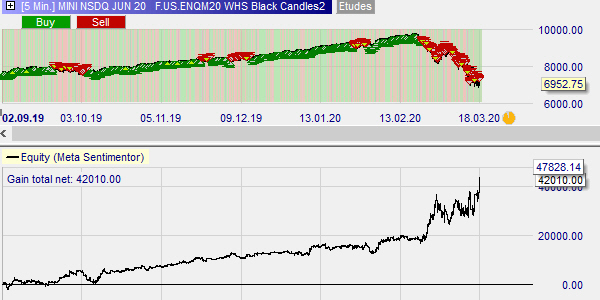
The Black Candle strategy has performed well since September 2019 as shown by the equity curve over this period:
2.c. CONCLUSION
Here is a day trading strategy that is interesting in the current period for its ability to generate trades in the direction of the main trend. One can see from historical data that it has been as effective during the slow rise of the Nasdaq. Of course, there is no guarantee that such a strategy will continue to perform in the future.
The opinion of a professional trader...

Visit the website of the legendary broker WH SelfInvest


