Test NanoTrader Full I Test Tradingview I Test the mobile platforms All for CFD-Forex & Futures
You are here
The Larry Williams Proxy Index trading strategy
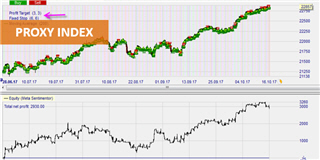
The Proxy Index is one of Larry Williams' most important indicators. It is an oscillator, which is used to identify trend reversals. Although the indicator is also suitable for swing trading, it is mainly used for day trading.
This strategy is available free of charge in the NanoTrader trading platform.
Overview of the Proxy Index strategy
The strategy is applied on 1-minute charts. Sufficient historical data must be available to calculate a 200-period moving average.
The L.W. Proxy Index is an oscillator. The oscillator is displayed below the main chart. As with any oscillator, there are two important thresholds, the upper limit and the lower limit.
When is a position opened?
If the oscillator rises above the upper limit, Larry Williams believes that the market price has dropped sufficiently. If the price is above the 200-period moving average at the same time (green chart background), he will consider buying orders.
This example shows the proxy index below the lower limit for the DOW Future. As the trend is bearish (red chart background in the main chart), a short sell position is opened.
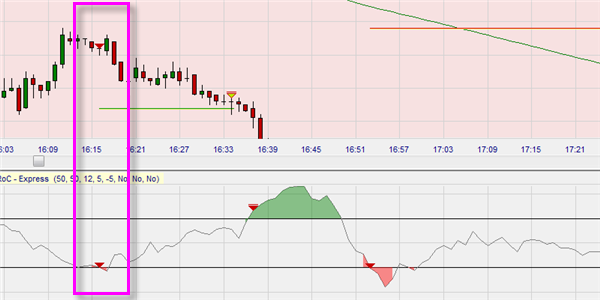
The values of the upper and lower limits of the proxy index vary from instrument to instrument. They also depend on the overriding market trend.
Tip: When setting the parameters of trading strategies, always open the equity chart. This chart shows the cummulative result of all the trades. It changes when you change the parameters of your strategy. This way you can immediately see the effect of your changes on the profit (loss) of your strategy.
This example shows the DOW Future. The values of the upper and lower limits of the proxy index are set to +5/-5 by default. The result is initially negative and later positive.
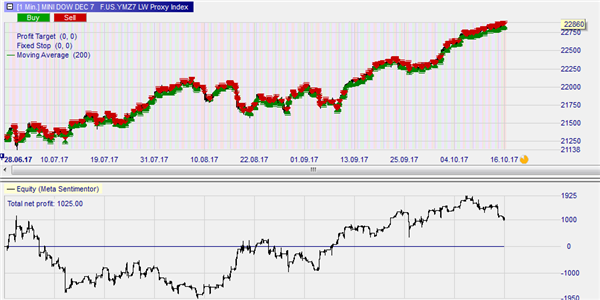
However, it is possible to achieve a better result. The overriding market trend is bullish. The DOW initially rises, then moves sideways and then continues its upward trend. Traders trade in the direction of the trend. This means that it makes sense to (1) prioritise buy signals by decreasing the value of the upper limit and (2) eliminate some short sell signals by increasing the negative value of the lower limit.
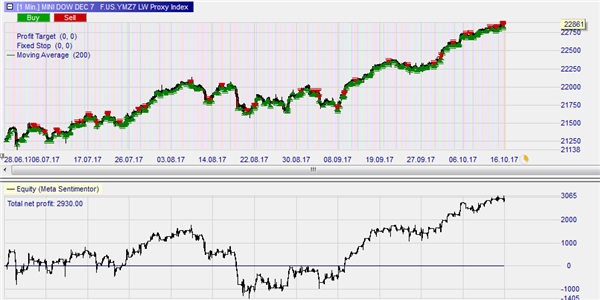
This example shows the DOW Future in the same time horizon as before. However, the upper and lower limit values have been changed to +2/-10. Note the reduction in short sell signals. The equity chart has improved significantly.
Recommended broker
When is a position closed?
The L.W. Proxy Index strategy uses a stoploss and a profit target.
When day trading in a 1-minute chart, the profit target is placed relatively close, usually at a distance of two to four times the ATR (average true range). The stop distance is twice that of the profit target.
The position can also be closed by the reverse signal or by the time filters integrated in the strategy.
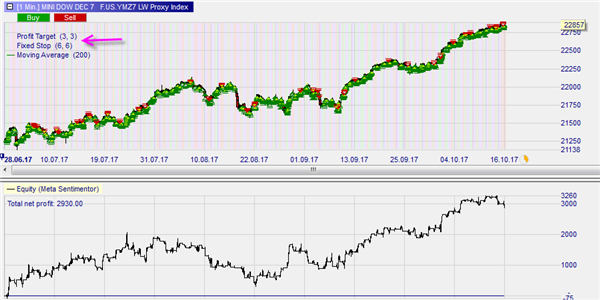
This example again shows the DOW Future over the same period. By adding the stop and the profit target, the result of the strategy is always positive. Please note that the strategy is profitable when the market goes up. In this case it benefits from the reduced number of short sell signals during this bullish market phase.
Conclusion
Traders must set the limits of the Larry Williams Proxy Index as well as the stoploss and profit target distances separately for each instrument. The overriding market trend should always be taken into account. Once this is done, the strategy seems to work well in trend phases.
People also read
The Larry Williams Volatility Break-out strategy
Automated trading: The Parabolic Combo
A good regulated managed account service


