Test NanoTrader Full I Test Tradingview I Test the mobile platforms All for CFD-Forex & Futures
You are here
Twin Charts

Twin Charts allow traders to analyse a market in multiple time frames. The Twin Charts –traders can have one or more– and the main chart are one whole. Draw, for example, a resistance line in the Twin Chart and it is also visible in the main chart.
Twin Charts offer traders the following advantages:
- An easy, comprehensive tool to analyse a market in multiple time frames.
- One or more Twin Charts can be added to a main chart.
- What the trader draws in the Twin Chart is visible in the main chart.
- Working orders and open position are visible in all charts.
- Trading from the chart, including one-click, can be done from all charts.
Download a free real-time demo of the NanoTrader Full trading platform
Opening a twin charts is easy ... click the twins icon.
![]()
1. REAL-TIME MARKET ANALYSIS IN MULTIPLE TIME FRAMES
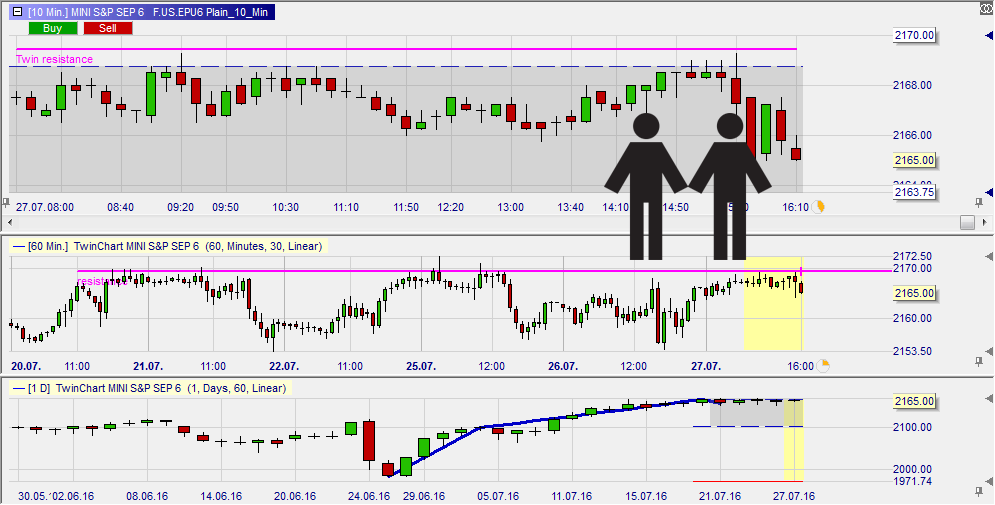
The above example shows a main chart (10 minutes) and two twin charts (60 minutes,5 days visible and 1 day, 60 days visible). The yellow zones in the twins correspond to the area visible in the main chart.
The resistance line from the 60-minute twin is visible in the main chart. The grey sideways zone generated by the zigzag trendline in the 1-day chart is also visible in the main chart.
2. USE IMPORTANT PRICE LEVELS FROM DIFFERENT TIME FRAMES TO MANAGE ORDERS
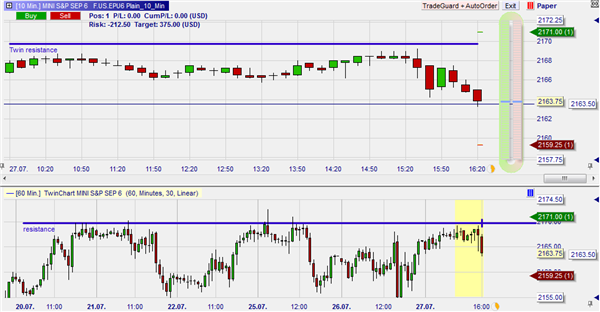
This example shows a main chart and one twin chart. The open position and the two bracket orders (green and red), which protect the position, are visible in both charts. Traders can slide these orders in both charts. This is very useful as the trader can slide his stop order, for example, to a support level indicated by the higher time frame chart.

Orders can be placed directly via the main chart or the twin chart. In the above example the trader uses the popular one-click ChartTrader .
Download a free real-time demo of the NanoTrader Full trading platform


