Test NanoTrader Full I Test Tradingview I Test the mobile platforms All for CFD-Forex & Futures
You are here
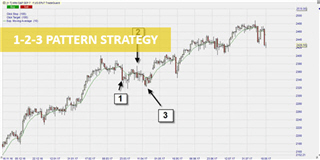
The 1-2-3 chart pattern trading strategy
The 1-2-3 pattern is a complete trading strategy. The strategy focusses on the optimal timing of the trade entry. It is a price action trading strategy, meaning it is based on pure price movement. The required price movement consists of 3 key points. These points are combined with a moving average of 10 periods to add confirmation of the trend direction.
A complete price action trading strategy
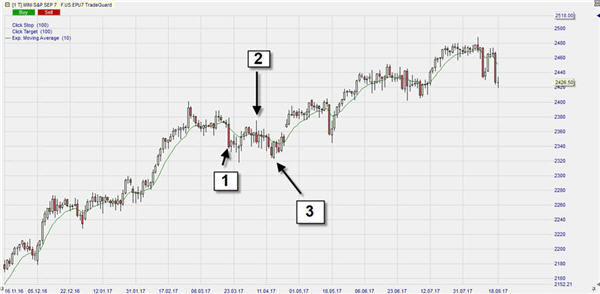
In this article we will refer to this illustration, which shows a 1-2-3 chart pattern in an uptrend. It is the S&P 500 future on a daily chart..
Points 1 and 2 in the chart pattern
Point 1 is the first support level in an uptrend. On 27 March 2017, there was the identification of point 1, with a low price of 2321 serving as a the first clear support level, after the retreat from the high at 2399 on 01 March 2017. From point 1, the price continued to rise to the high of 2374 on 05 April 2017. This high, which is not higher than the highest high in the uptrend, is point 2 in the strategy. It is also a point where the price temporarily reached a high and fell back in the next few trading days. Thus, point 1 is a temporary low in an uptrend and point 2 is a temporary high in an uptrend.
Point 3 in the chart pattern
Point 3 is the actual signal to enter the trade. It was a trading day with a high and a low between the low from point 1 and the high from point 2. This works in the same way as the Fibonacci retracement levels, by following the same logic that in an uptrend - if the trend is still valid - the underlying financial instrument should create a higher high and a higher low. So on 17 April 2017, we have the formation of point 3. The entry is a few points above the price breakout above point 2. In this case, the entry is a buy order at 2380. The stop loss is a few points below the low of point 3, or at 2315, as the low for point 3 on 17 April 2017 was above 2320.
With a risk-reward ratio of 1:2, the trader can set a price target 130 points above the entry at 2380, namely at 2510. This price target has not yet been reached. A risk-reward ratio of 1:1, with a risk of 65 points starting from the entry at 2380 and the price target of 65 points would have been profitable, as the lower target of 2445 was reached on 09 June 2017.
The EMA indicates the market trend
In this trading pattern, there is also a 10-period moving average (EMA) that serves as confirmation of a valid trend direction, in this case the trend is up. The only condition for the moving average is that it must also be rising to confirm the trend. This condition was met when the 10-day moving average trended upwards for a long period of time.
A conservative trading strategy
The 1-2-3 chart pattern strategy is easy to apply. In this example, the price target has yet to be reached with a risk-reward ratio of 1:2. Nevertheless, the trade is profitable so far. The additional confirmation supplied by the EMA makes the strategy more conservative. The main idea of this strategy is to go with the main trend, be patient and time the entry.
If you do the effort of learning how to spot this simple chart pattern, you will be rewarded. Your reward are quality trading signals with good profit potential and limited risk. The positions do not put undue pressure on the trader.
People also read
- Detecting chart patterns
- Detect your own candlestick patterns
- The secret king of chart patterns: The Wolfe Wave
"Do more of what works and less of what doesn’t."
- Trader Steve Clark
Free demo

Trading videos
Charting, strategies, automated trading, backtesting, playback... watch these videos and become a platform master.

Broker
WH SelfInvest serves traders from offices in Germany, France, Switzerland, Belgium, Luxemburg and the Netherlands.
The spectacular SignalRadar
SignalRadar shows live trades being executed by various trading strategies.
More ...
- 1 of 5
- next ›