Test NanoTrader Full I Test Tradingview I Test the mobile platforms All for CFD-Forex & Futures
You are here
The ATR Channel Breakout Trading-Strategy
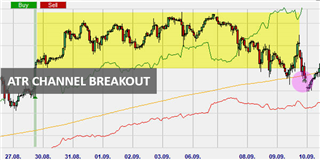
Trend trading can be one of the most profitable trading strategies for short and long term traders. However, most trend traders rarely consider the prevailing market volatility when deciding when to enter or exit a position, resulting in missed opportunities. With the ATR Channel Breakout trading-strategy, you can combine volatility and trend trading.
Advantages of the the ATR Channel Breakout trading-strategy:
- simple trading of outbreaks with volatility
- provides convenient exit levels for TP and SL
- identifies the support and resistance levels based on recent volatility
What is the ATR?
ATR stands for Average True Range. It is a volatility indicator, i.e. it shows by how much the price of an asset has fluctuated in a given period. The ATR indicator can be calculated in one of the following ways:
- The difference between the current high and low
- The difference between the current high and the last closing price
- The difference between the current low and the last closing price
When the ATR increases, it usually indicates increasing volatility, and when it decreases, it means that market volatility is also decreasing. Note that the ATR is not a trend indicator. So it does not mean that the market is in a bull market when it is rising, and vice versa. This non-directional aspect of the ATR indicator makes it an ideal indicator for identifying potential breakout areas.
What is the ATR Channel Breakout Trading-Strategy?
Unlike the ATR indicator, the ATR Channel Breakout strategy is trend following. However, the strategy uses the ATR indicator to measure asset volatility rather than the traditional one-line oscillator. In this strategy, the ATR has been converted into a channel that uses the average of the asset's closing price. The channel provides the ideal benchmark for breakouts - the upper and lower boundaries of the channel serve as support and resistance lines.
Ideally, the channel represents the expected price range of the asset. A breakout occurs when the price shoots out of these ranges and triggers buy or sell signals. To increase the efficiency of the signals generated during a breakout, you should pay attention to the changes in the traded volume. An increase in volume during the breakout increases the accuracy of the signal.
How to trade with the ATR Channel Breakout trading-strategy
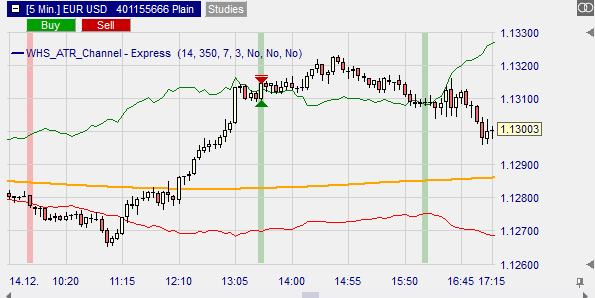
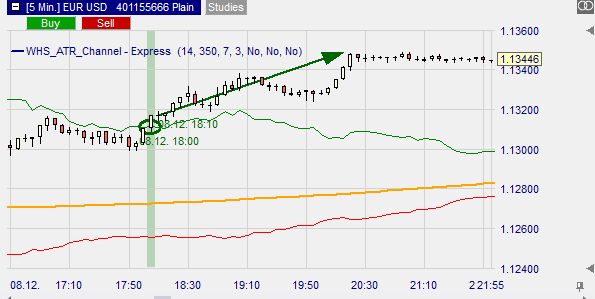
When to buy?
The bullish signal is generated when the price breaks out of the upper limit of the ATR channel. Remember that the upper limit of the channel serves as a resistance. Since this resistance is calculated using the ATR indicator, a breakout means that the current price volatility is significantly above the average.
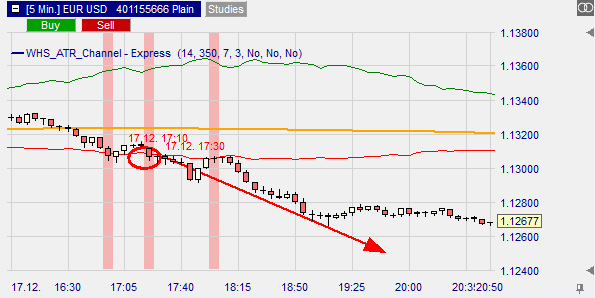
When to sell?
The sell signal is generated when the price breaks out of the lower boundary of the ATR channel, which serves as a support level. This downward signal should also be accompanied by a significant increase in the traded volume. The logic behind this is that when the price breaks the lower boundary, the current price falls faster than the average, and the increase in volume means that a larger number of traders are shorting.
When should a position be closed?
This trading-strategy does not provide automatic take profit and stop loss levels. To place your take profit, you use the ATR indicator and determine the average price fluctuation in the time frame you are trading. For example, if you trade daily candles and the ATR is 40 pips, your stop levels should be around that level.
As a stop loss level, use the middle orange line in the ATR channel breakout strategy - this line is a simple moving average (SMA).
Conclusion
Regardless of the market you are trading, an overview of volatility is always important. The ATR Channel trading-strategy modifies the volatility trading capabilities of the ATR indicator into a trend trading strategy suitable for trading breakouts.
People also read these trading articles
Free demo

Trading videos
Charting, strategies, automated trading, backtesting, playback... watch these videos and become a platform master.

Broker
WH SelfInvest serves traders from offices in Germany, France, Switzerland, Belgium, Luxemburg and the Netherlands.
The spectacular SignalRadar
SignalRadar shows live trades being executed by various trading strategies.
More ...
- 1 of 5
- next ›