Test NanoTrader Full I Test Tradingview I Test the mobile platforms All for CFD-Forex & Futures
You are here
The COT Report Signal - A profitable futures trading strategy
In this article we present a strategy based on the Commitment of Traders (COT) report data. The author, together with his business partner, was able to grow his account from 14,000 to 300,000 US dollars within four years. In order to have his approach put to the test, the author took part in the real-money competition at the World Championship of Futures Trading and won third place there in 2017.
Trading with COT data is only possible with futures. If you are interested in futures trading, enjoy reading these FREE e-books...
How to scalp the Mini-DAX future? I Futures and futures trading I Trader profile – The Scalper
A trading strategy based on the COT Report
The COT signal
Trends arise from fundamental changes in the market and not through charts. The basis of this strategy is the COT data. The Commitment of Traders Report shows current trading positions held by market participants, who are obliged to report their open positions. The aim of the COT report is to make current open options and futures contracts transparent. The data is published every Friday after the close of trading. In this way other market participants can verify the positions of the large investor categories (commercials, large traders and small traders).
We have taken advantage of this information and analysed the behaviour of these three groups using the COT reports from 1983 to 2013. The analysis taught us how the the big players position themselves before a price rally. This knowledge is the basis of our trading strategy.
To generate the COT signal we use an indicator called the COT Commercial Index. It puts the net positions of the commercials in relation to the highest and the lowest level over a chosen time period. This approach creates an oscillator, which fluctuates between 0 and 100.
Most traders only use a COT commercial index. We have gone one step further and use two variants. This way we distinguish two groups of commercials with different hedging horizons. This increases the quality of the COT signals, which are generated as follows:
- Long signal: when both the 6-month Commercial Index and the 12-month the Commercial Index rise above 75
- Short signal: when both the 6-month Commercial Index and the 12-month the Commercial Index drop below 25
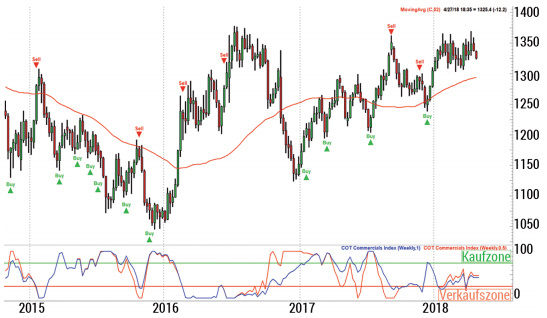
Every Sunday we scan 30 futures markets for our COT signal. Figure 1 shows the COT signals for the gold future. Red arrows show short signals and green arrows show long signals. As you can see, the COT signals are very reliable, especially when they match the weekly trend.
In our experience, to be able to trade this COT strategy, you need at least 15,000 US dollars in your trading account, 30,000 US dollars would be better. The disadvantage of a small account is that you cannot trade all setups because otherwise you take too high a risk. You are always obliged to choose one of the many setups that present themselves. With a 30,000 US dollar account you can already trade two to three signals in parallel and simply make better progress. The authors only had 14,000 US dollars at the beginning. However, after backtesting the strategy, they had a clear idea of how high the drawdown can be and how many losses can come one after the other. This gave them the necessary confidence their small trading account would last.
Additional filter conditions
As soon as a COT signal is identified, proceed as follows (see also Figure 2):
- Step 1: Weekly trend. After getting a COT signal, we first check the weekly trend. As already mentioned, signals are more reliable if they match the direction of the trend.
- Step 2: Commercials and Open Interest. To confirm our COT signal, we also look at the open interest and the commercials. The long signal is confirmed if commercials buy and open interest falls at the same time. The short signal is confirmed when the commercials sell and the open interest rises at the same time.
- Step 3: Sentiment. As the next confirmation we look at the sentiment, i.e. the mood of the masses. The long signal is confirmed when the sentiment of the masses is negative (our indicator shows a value below 25). The short signal is confirmed when the sentiment of the masses is positive (our indicator shows a value above 75). We sometimes use the Trade Navigator software. Trade Navigator offers two sentiments, one fast and one slow. Ideally, both are in the same range.
- Step 4: Seasonal trend. Now we look at the seasonal trend. First, we want to know if the price evolves in the direction of the seasonal trend. Second, we check whether this trend confirms the COT signal.
If the above conditions are met, the COT signal is perfect. Of course, not every signal is perfect. As a rule, however, two out or three confirmations are sufficient to not reject the signal.
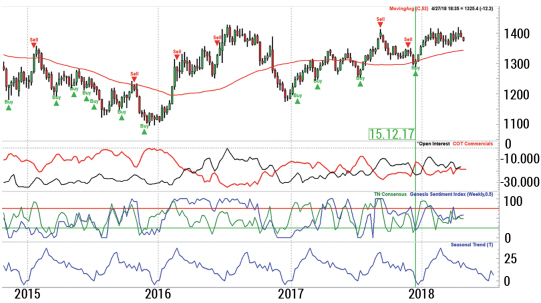
Figure 2. Commercials, Open Interest, Sentiment and Seasonality. The chart shows that the COT long signal is confirmed when commercials (red in the sub-chart below) buy and open interest (black in the same sub-chart) falls at the same time. The COT short signal is confirmed when the commercials sell and the open interest rises at the same time. The middle sub-chart shows: The long signal is confirmed when the sentiment of the masses is negative Indicator shows a value below 25). The short signal is confirmed when the sentiment of the masses is positive (indicator shows a value above 75). The seasonal trend can be seen in the lowest sub-chart. The price should The price should follow this and confirm the COT signal.
Important: Experience from real trading shows that COT signals have a validity of about six weeks. Back-testing confirms this. Every week we check the confirmation factors of the COT signal. If they remain valid, the future remains on the watch list.
Timing of the entry
In order to determine whether the right time for an entry has come, we take the daily chart and look at the trend structure there. It should indicate a trend reversal with its lows and highs. Divergences also indicate a possible trend change. The Momentum Indicator or the Relative Strength Index (RSI) are suitable for detecting divergences.
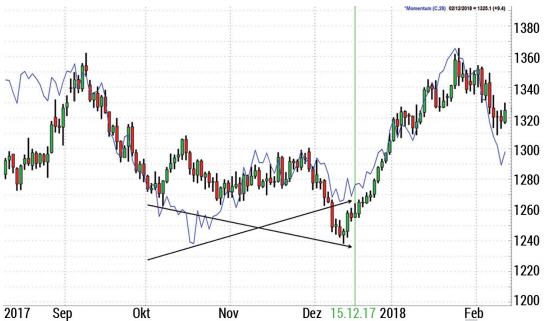
Figure 3. The illustration clearly shows that even before the COT signal, the market price was always hitting new lows. However, The momentum, however, did not follow the price, creating a divergence (black lines). This is a good indication of a potential trend reversal.
If divergences are present or the trend structure indicates a trend reversal, the search for an optimal entry begins!
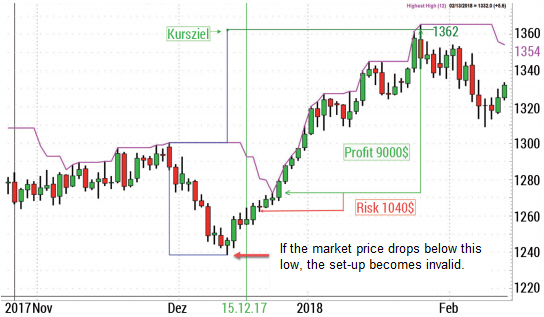
We use different entry techniques. An effective and simple variant is to enter using the 12-day extreme (see Figure 4). In this example, we received a COT signal on 15 December. A divergence between price and momentum developed in the daily chart. The price turned around and reached the 12-day high. This is our entry point. The stop loss was placed below the 3-day low and the price target was target was defined by the projection of the last trend upwards. The price target was reached and we were able to pocket a profit of 9000 US dollars with a risk of only 1040 US dollars.
Figure 4. Entry and exit.
Important: If the lower low is broken, i.e. the secondary trend continues, we consider the setup as invalid for the time being and wait until the trend structure indicates another trend reversal. This procedure sounds complicated, but in practice it is very easy to implement. We have the weekly trend (main trend) and the daily trend (secondary trend). The secondary trend is the correction of the main trend. When the secondary trend turns in the direction of the main trend, we look for an entry. If If the secondary trend continues, we do nothing and wait for the next opportunity.
Recommended broker
People also read
- The Commitments of Traders Report (CoT) Part 1
- The Commitments of Traders Report (CoT) Part 2
- A swing trading strategy using CoT report data
If you are interested in a good managed account, check out this service...
"It is the extreme positions of the commercials that excite us - the extreme bullish and the extreme bearish values have the strongest predictive power."
- Larry Williams
Free demo

Trading videos
Charting, strategies, automated trading, backtesting, playback... watch these videos and become a platform master.

Broker
WH SelfInvest serves traders from offices in Germany, France, Switzerland, Belgium, Luxemburg and the Netherlands.
The spectacular SignalRadar
SignalRadar shows live trades being executed by various trading strategies.
More ...
- 1 of 5
- next ›