Test NanoTrader Full I Test Tradingview I Test the mobile platforms All for CFD-Forex & Futures
You are here
Day trading using moving averages (part 2)
A basic trading strategy based on simple moving averages is the moving average crossover strategy. Opinions are divided on this simple strategy with some traders saying it has proven to be unworkable whereas others seem to be more open. Those in favour defend the strategy on the basis of its simplicity and the fact that if a big market move occurs, the strategy tends to often capture nearly the whole move, which is not always the case with other strategies. The ‘danger zone’ for this strategy -like for many other strategies- is a market which moves sideways. Caveat emptor.
As mentioned in part 1 of this series the objective is not to judge these public domain strategies. The objective is to explain how they work and indicate what the best parameter settings could be.
Download a free real-time demo of the NanoTrader Full trading platform
GOLDEN CROSS AND DEATH CROSS
These two moving average crosses come from the swing trading universe. Traders use a fast 50-day simple moving average and a slow 200-day simple moving average. When the 50SMA crosses the 200SMA upwards it is considered a buy signal called the Golden Cross. When the 50SMA crosses the 200SMA downwards it is considered a short sell signal called the Death Cross.
Day traders ‘translate’ these parameters into fast 10-period moving average (red) and a slow 20-period moving average (blue) on a 5-minute chart. Let’s have a look at some practical examples on the forex pair EUR/JPY.
EUR/JPY, 5-MINUTE CHART, GOLDEN CROSS
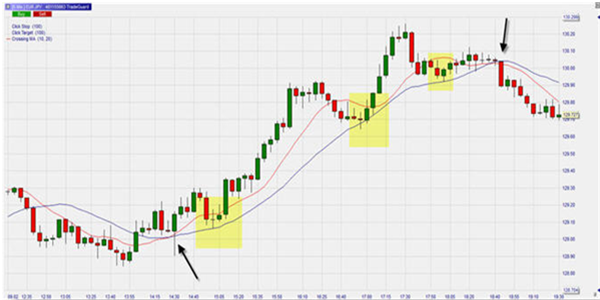
At 14h30 the 10SMA (red) crosses the 20SMA (blue) upwards. At the same time the 5-minute candle closes above both the SMAs. This is a Golden Cross and a valid buy signal (first black arrow). During the trade, we see three slow pullbacks (yellow zones). These pullbacks push the 10SMA down but not enough for it to cross the 20SMA downwards.
Day traders who prefer to let their profits run, have no reason yet to close their position. Only at 18h45 the fast moving average crosses below the slow moving average. At the same time a candle closes below the two moving averages (second black arrow). This is the definition of a Death Cross and thus a short sell signal; the long position can either be closed or switched into a short position, if so desired.
At this point, all traders should have closed their long position. Traders who analyse the chart carefully will have noticed that the momentum weakens significantly at around 17h50 as indicated by both SMAs going sideways. When this phenomenon occurs, traders should consider to either partially close their position or to move their stop(s) closer to the market price.
EUR/JPY, 5-MINUTE CHART, DEATH CROSS
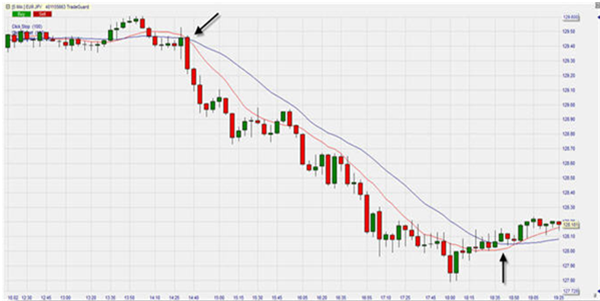
At 14h40 a Death Cross occurs when the fast SMA crosses below the slow SMA and at the same time a candle closes below both SMAs (first black arrow). This is a short sell signal. With no pullbacks occurring and a steady downwards, both SMAs stay nicely separated and nearly parallel; a clear sign of strong momentum.
At 18h45 a first close above the slow SMA (blue) (second black arrow) occurs. Traders must close their positions now. In this example we can also see the warning signs some 30 minutes before the close signal when the two SMAs start to move sideways.
When using the crossing moving averages it is important to not just act on the crosses themselves but to also ‘read’ the market. As long as the SMAs stay nicely separated and run almost parallel, the momentum is there. If the SMAs start moving towards each other and sideways, this is a warning sign. Momentum is decreasing and positions could be (partially) closed or stops could be adjusted. A close above or below the slow SMA (blue) is a definite close signal.
Download a free real-time demo of the NanoTrader Full trading platform
Free demo

Trading videos
Charting, strategies, automated trading, backtesting, playback... watch these videos and become a platform master.

Broker
WH SelfInvest serves traders from offices in Germany, France, Switzerland, Belgium, Luxemburg and the Netherlands.
The spectacular SignalRadar
SignalRadar shows live trades being executed by various trading strategies.
More ...
- 1 of 5
- next ›