Test NanoTrader Full I Test Tradingview I Test the mobile platforms All for CFD-Forex & Futures
You are here
Day trading using moving averages (part 3)
This article focuses on combinations of specific candlestick patterns and specific moving averages. Japanese candlestick patterns have become popular with traders. The patterns often have original and exotic sounding names such as ‘Evening Star’, ‘Harami Cross’ or ‘Three Soldiers’. Although candlesticks are nothing more than visualisations of price movements in a specified period of time, it is fair to say that certain patterns and formations can provide an insight into how the market is behaving and how the market might move.
Download a free real-time demo of the NanoTrader Full trading platform
CANDLESTICK PATTERNS AND A MOVING AVERAGE
When interpreting candlesticks patterns and formations it is important to do so in the context of chart technical analysis. A Hammer pattern, for example, is far more significant when it coincides with a support level in the chart instead of appearing somewhere randomly. In this article candlestick patterns are combined with an Exponential Moving Average calculated over 30 periods (EMA30). The following set of trading rules applies:
TRADING SET-UP
Long trade:
- Pull-back towards the EMA30.
- Bullish candlestick pattern with a close above the EMA30.
- Buy signal when the price breaks the highest price of the last candlestick.
Short sell trade:
- Pull-back towards the EMA30.
- Bearish candlestick pattern with a close below the EMA30.
- Sell short signal when the price breaks the lowest price of the last candle
EUR/JPY, 5-minute chart
This EUR/JPY example shows a bullish set-up, which happens shortly after the so-called ‘London open’ (yellow) at 9h00. After an hour of sideways movement prior to the London open, bullish investors enter the market as indicated by the big green candle (yellow). Shortly after the appearance of this candle a small Hammer pattern with a pull-back towards the EMA30 (first black arrow) occurs. This was the start of a strong and long lasting buy opportunity. The position remains open until the market price closes below the EMA30 (third black arrow).
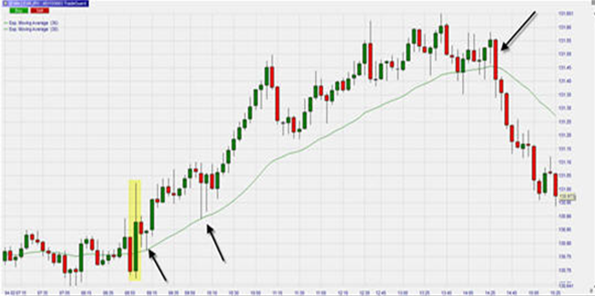
Interesting about this trade is the fact that three more Hammer patterns occur after the first one (an example is indicated by the second black arrow). In other words, bullish investors continue to buy on each pullback towards the EMA30. Traders had four different opportunities to buy a long position.
EUR/JPY, 5-minute chart
This example shows an interesting short sell signal. After the market price has fallen below the EMA30, a clear nice pull-back towards the EMA30 line occurs. This coincides with the occurrence of a Bearish Engulfing pattern (first black arrow). A short sell at the breaking point of the low of this Bearish Engulfing pattern results in a very profitable short sell trade. The market price never pulls back towards the EMA30 and maintains a strong downwards momentum. The position remains open until the market price closes above the EMA30 (second black arrow).
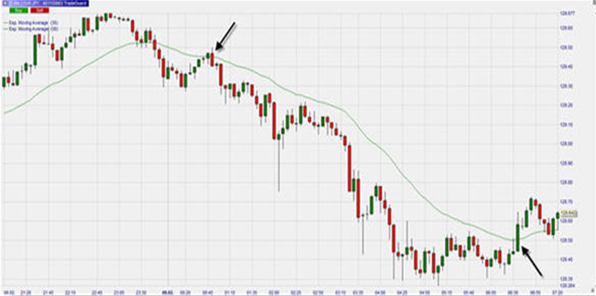
Close observation of the situation shows that before the close above the EMA30 occurs, the market already start moving sideways. Depending on the trader’s style, more aggressive traders may have closed their positions already at that point.
CONCLUSION
When combining candlestick patterns and the EMA30 traders need to take into account the entire context of the market situation and need to adhere to trading rules such as those set out above.
Download a free real-time demo of the NanoTrader Full trading platform
Free demo

Trading videos
Charting, strategies, automated trading, backtesting, playback... watch these videos and become a platform master.

Broker
WH SelfInvest serves traders from offices in Germany, France, Switzerland, Belgium, Luxemburg and the Netherlands.
The spectacular SignalRadar
SignalRadar shows live trades being executed by various trading strategies.
More ...
- 1 of 5
- next ›