Test NanoTrader Full I Test Tradingview I Test the mobile platforms All for CFD-Forex & Futures
You are here
Deron Wagner's Base Pattern trading strategy
Deron Wagner is a swing trader from the USA. He worked as a hedge fund manager before founding his company Morpheus Trading in 2002. Over the years he has published several books, both as an author and as a co-author, which has given him a degree of notoriety.
The Base Pattern strategy
Deron Wagner analyses his ideas on the basis of weekly and daily charts. He uses technical indicators and patterns as instruments, which he combines within coherent setups to arrive at plausible trading decisions. His favourite setup is the base pattern. This describes an ideal form of consolidation of a share before a breakout to new highs occurs, followed in all likelihood by a sustained continuation of the trend. The pattern has been known for a long time and was described, for example, by William O'Neil as the Cup and Handle Pattern or by Mark Minervini as Specific Entry Point Analysis (SEPA). Deron Wagner, however, developed his own coherent definition, which we look at in more detail below.
Note: If you're not into swing trading and you are not known for your patience, jump to the next article.
Deron Wagner's definition of the pattern
First of all, a strong initial movement is important. This is necessary to define the overriding trend upwards so that the current price is above its GD(200). As soon as a consolidation occurs, Deron Wagner looks for typical signs of a valid base. Ideally, the formation of a base lasts between one and three months and corrects 10 to 30 percent of the previous price increase. At the end of the base, the GD(50) should be above the GD(200), with both lines rising and quoting below the current price. Ideally, the price should even stop at the rising GD(20). In addition, a higher low should develop in the base so that the price movement narrows under decreasing volatility and the lowest possible volume and thus gathers strength for the breakout.
What sounds complicated at first looks quite simple on the chart. The difficulty lies in finding the pattern, which takes some time. In addition, patience is necessary until a buy signal occurs when the price breaks out above the high of the base. Also, when exiting, one should not be hasty and only take profits when the price shows clear signs of being overbought.
It is also important to note Deron Wagner's advice that this pattern should not be traded in a general bear market.
A trading example
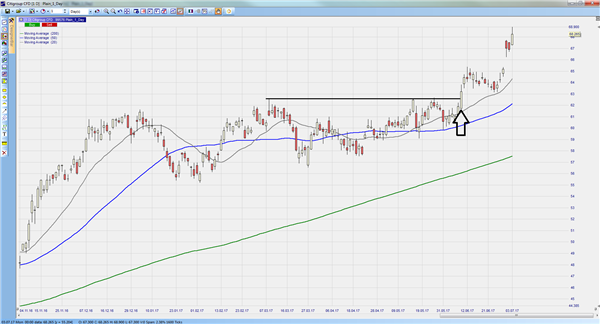
The Citigroup share price rose sharply from November 2016 and traded well above the GD(200) shown in green. In March, the price reached another high and then formed a base. Within this base, the first price decline was the sharpest. This was followed by a higher low. The next setback stopped at the GD(50) shown in blue. At the same time, the range narrowed. The breakout above the high of the base represented the buy signal (arrow). Another setback followed, which already stopped above the old high and the GD(20).
People also read
"Don’t worry about what the markets are going to do, worry about what you are going to do in response to the markets."
- Michael Carr
Free demo

Trading videos
Charting, strategies, automated trading, backtesting, playback... watch these videos and become a platform master.

Broker
WH SelfInvest serves traders from offices in Germany, France, Switzerland, Belgium, Luxemburg and the Netherlands.
The spectacular SignalRadar
SignalRadar shows live trades being executed by various trading strategies.
More ...
- 1 of 5
- next ›