Test NanoTrader Full I Test Tradingview I Test the mobile platforms All for CFD-Forex & Futures
You are here
Filter and improve (free) trading signals

Where does a trend start, how does it progress and where does it end? Over many weeks and months, prices can run in the chosen direction of the trend without any major setbacks. Especially for short-term traders, it is important to clearly evaluate the current market and to recognize trends as well as potential trend reversals at an early stage. After all, a strategy only works well if it fits the market environment and is correctly timed.
Filter and improve trading signals
Measuring the strength of a trend
Preliminary thoughts
"In phases of strong trends, use trend-following concepts; in sideways phases, use oscillator models." This or something similar is the often well meant but somewhat sweeping suggestion to deal with the markets in general from a technical point of view.
But when is the trend a trend? And is this declaration correct at all? Many technical indicators can help to answer this question. Depending on the calculation method, a market can be interpreted and quantified in terms of its trend strength. This allows a clear distinction to be made between trend and sideways movement, which in turn creates better preconditions for deploying strategies that have proven themselves in these given market environments.
In the remainder of this article, an overbought/oversold trading strategy will be used in various markets without any special criteria. In the subsequent test, it is examined whether a trend filter in the form of the ADX indicator (Average Directional Index) can permanently improve the quality of the signal by avoiding positions that would have been opened in phases of high trend strength.
In order to eliminate statistical coincidences as much as possible and to present the best possible comparability of different markets, the tests were examined on six commodity markets and four stock indices. Daily bars in the period from 2005 to May 2009 were used, any commissions and slippage were not taken into account.
Recommended regulated managed account service...
Basic version SMI10/3/3
As an example, a classic oscillator system is used that is supposed to classify the market as cheap (oversold) or expensive (overbought) and open long and short positions accordingly. As mentioned at the beginning, a preliminary consideration is that the system should act more profitably in sideways phases than in trend markets.
The Stochastic Momentum Index is used as an overbought/oversold indicator. The SMI works with fewer swings than the classic fast/slow stochastic and thus generates a somewhat smoother pattern, which makes it easier to interpret. The last ten closing prices are used as parameters; both smoothed values of the indicator are measured with three units.
First, the quality of the Stochastic Momentum 10/3/3 should be assessed. In principle, as with almost all oscillators, one could trade an intersection with the zero line or the intersection with the signal line. However, what is interesting for the setup is the signaling from the extreme ranges of the indicator, specifically at -40 for buy signals and +40 for sell signals. The long entry is made when the indicator crosses the oversold zone, short positions are opened when the indicator crosses below the oversold zone. The objective of profiting from a sideways market is thus best fulfilled compared to the other two methods. . Generating signals through intersections with the zero line would have a trend-following component, while a signal line in the indicator delays the entry. For both entry and exit, positions must be opened or closed at the first price on the day after the signal is generated.
Money management and exit
The system runs with an initial risk stop of 2% and a take profit of 10%. There is also a time stop at 3 days. Unless a 3% movement in the underlying occurs, the position is liquidated after three days. This approach protects against unpleasant surprises, increased market volatility and, above all, should ensure relatively low drawdowns.
Apart from these three exit scenarios based on money management, the system works with an exit based on the SMI, which can be displayed quickly and easily: If the indicator turns in the opposite direction after the entry, the position is liquidated. Table 1 shows the results of this oscillator system when used in any market phase.
Performance report SMI10/3/3 without trend filter. Table 1 shows the performance of the SMI10/3/3 signals in terms of hit ratio, profit ratio and activity. It can be seen that only relatively low hit ratios are to be expected on almost all markets. A simple signal generation by the SMI10/3/3 performs particularly poorly on equity indices.
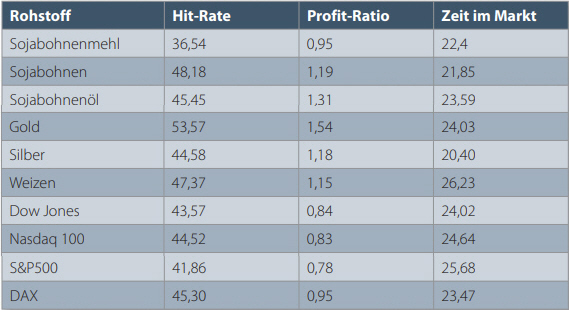
(Rohstoff = Commodity; Zeit im Markt = Percent of time in position).
As Table 1 shows, pure overbought/oversold models without further analysis are inadequate in the long run. Although the results of the individual markets fluctuate, all in all only gold seems to be able to deliver appealing results under the given conditions.The systems work profitably with a profit ratio (all profits / all losses) of 1 or more. None of the listed stock indices manages to achieve profits in the long term with the setup. The hit rates are also too low in the commodities.
Recommended broker...
Filtering strong trends with the ADX14
The Average Directional Index is considered one of the most widely used trend strength indicators and forms the basis of many trading systems. In general, values above 30 are considered strong trends, values below 30 signal sideways phases, and values close to 10 indicate strongly oscillating markets without a trend. The standard setting of the indicator is 14, but other values can also be used depending on the purpose.
What improvement can be expected if the system is equipped with a trend filter? Here it is useful to consider in advance which basic properties a trend filter has in a particular market. The ADX indicator is tested in various parameter settings. Figure 1 shows how long a market enters its ADX extreme zone > 30 on average, how many price units it remains in it and finally leaves it again. Here, agricultural commodities in particular form the most continuous short-term trends. The relatively weak trend strength of the stock markets is also confirmed in this evaluation, because in all period settings the results are far below the benchmark. All in all, stock indices can be expected to stay in their extreme zones for about four to six days on average, commodity markets for about six to ten days.
Trend strength according to ADX > 30 in percent. Figure 1 shows the comparison of ADX10, ADX14 and ADX20. How much time in percent is the indicator in its extreme range > 30 positioned in the market? The shorter the period setting, the less effectively the indicator filters the market. In general, commodities stay in their extreme ranges somewhat longer than stock indices.
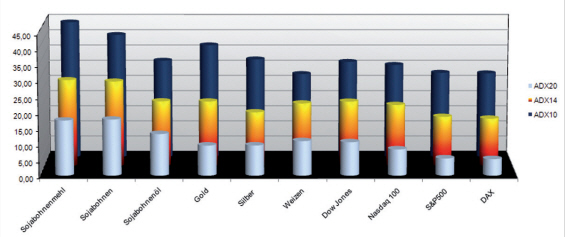
The statistic gives an indication of how far trends in a particular market are capable of developing and after how many price units a stronger pullback or entry into a sideways movement is likely to occur. Furthermore you get an idea of how many less trading signals you can expect if the indicator serves as a signal filter for distinguishing trend phases from non-trending phases. We will now examine the basic version of the oscillator-model SMI10/3/3 presented above in order to see if there are less signals of a better quality.
Recommended regulated managed account service...
System SMI10/3/3 filtered using the ADX14
All trading signals that are accompanied by a higher higher ADX14 value than 30 are rejected. All other conditions remain the same. Are trends indicated early enough to eliminate false signals and improve the oscillator model? The results compared to the standard oscillator model are shown in Table 2. The trading signals could be improved in every market, sometimes very significantly.
Performance report SMI10/3/3 filtered by ADX14. Table 2 shows the performance of SMI10/3/3 signals filtered by an ADX14 > 30. A better quality of signals and a lower frequency yields more profit in almost all markets.
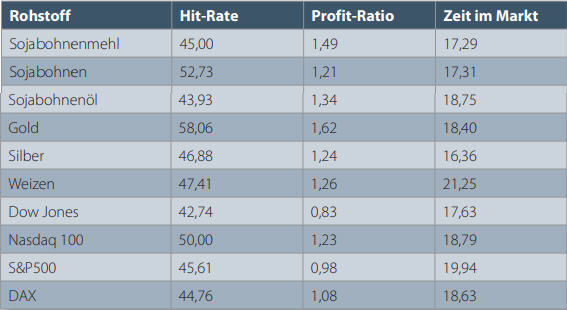
(Rohstoff = Commodity; Zeit im Markt = Percent of time in position).
The ADX as a filter has apparently succeeded in ridding the markets of many false signals. In addition to partly positive hit ratios, all markets, apart from the Dow Jones and S&P500, have a positive expected value. Gold deserves special mention: for every 1,000 euros lost, there are 1,620 euros gained with a hit rate of 58 percent. This is really not bad, especially since only low risk tolerances were accepted due to the tight stop criteria. In addition, the trading frequency drops significantly, in general about every fourth trade from the SMI10/3/3 standard model is ignored, yet the systems are still on average about 20 percent in the market. Even a simple trend filter can turn an unsuccessful setup into a profitable system. Conversely, one can roughly imagine how the oscillator model would work if it acted exclusively in trendy markets with ADX > 30: A short-term trend-following model has a much higher chance of winning when the trend is strong. A market that has risen or fallen sharply is therefore not always "overheated and overbought or cheap and oversold".
Conclusion
By using trend strength indicators such as the ADX, the status of a market can be made transparent and trend or sideways phases can be clearly distinguished. As the strategy example shows, the ADX offers real added value as a filter device for trend following or oscillator systems. It makes trading activity more selective, which is reflected not least in significantly higher profits. Source: Traders' Mag.
People also read
- Intelligent filters for filtering trading signals
- Automated trading: Parabolic Combo
- A good managed account
"Limit your size in any position so that fear does not become the prevailing instinct guiding your judgment."
- trader Joe Vidich
Free demo

Trading videos
Charting, strategies, automated trading, backtesting, playback... watch these videos and become a platform master.

Broker
WH SelfInvest serves traders from offices in Germany, France, Switzerland, Belgium, Luxemburg and the Netherlands.
The spectacular SignalRadar
SignalRadar shows live trades being executed by various trading strategies.
More ...
- 1 of 5
- next ›