Test NanoTrader Full I Test Tradingview I Test the mobile platforms All for CFD-Forex & Futures
You are here
How John Bollinger invented the Bollinger Bands and more
John Bollinger is president and founder of the asset management firm Bollinger Capital Management. A true analyst, he has developed a number of well-known analytical tools in his career - most notably his Bollinger Bands, which are now included as a standard tool in virtually all software. His book "Bollinger on Bollinger Bands" was published in 2001 and translated into eight languages. Bollinger also publishes a monthly stock market letter with weekly updates, the Capital Growth Letter. This presents market commentary, analysis and investment ideas for private investors pursuing a technically oriented investment strategy.
John Bollinger is also known to the public for his many years as a market analyst and commentator on the FNN and CNBC television channels. He is also a sought-after speaker at financial conventions around the world. We caught up with the busy market specialist for an interview. Source: Traders Mag
| Available from John Bollinger in the NanoTrader trading platform: |
| 1. Trading strategies and signals |
| The Trio strategy |
| The Open Trade HA-BB strategy |
| The Dynamic RSI strategy |
| The Trendplus strategy |
| 2. Trading tools |
| Bollinger Volatility Explosion |
| Bollinger Oscillators (Bollinger %b-Indikator) |
| BB MACD |
| Traders Dynamic Index |
| 3. SignalRadar more... |
Interview with John Bollinger, the inventor of the Bollinger Bands
- Mr. Bollinger, you made a career change into the financial services industry. Can you tell us how you got in touch with the stock market in the first place?
John Bollinger: That's right, originally, I did something completely different. I studied cinematography and then worked in the film industry. In total, I spent ten years of my life in this industry. I only came into contact with the stock market when my mother retired and was looking for someone to manage her pension funds. I took on this task. During that time, I studied the stock market extensively, read a lot and, of course, learned a lot in the process. I also studied how to recognize good companies based on fundamental criteria, but I never really warmed up to it. Over time, I became more and more interested in the technical view of the markets and realized technical analysis was more suitable for me than fundamental analysis.
- Can you still remember your first trade?
John Bollinger: But of course. My first trade was the perfect beginner trade, and I'll tell you why. I had gotten shares of Fruehauf Corporation from my grandfather when I was a teenager and held them for many years. With that trade, I learned that a stock does not have to go up at all in the long run. It was a total loss, which made me aware of the risks of speculative trading from the start - which is exactly what beginners need. If the first trade is a big win right away, there is a risk that you overestimate yourself and make big mistakes afterwards. A negative experience at the very beginning, so to speak, can be a huge gain in the long run.
- What was the most important thing you learned on your voyage to becoming a professional trader?
John Bollinger: I can tell you exactly that: discipline. I believe that ultimately that's all that matters. I can remember an acquaintance who was basically good at what he did. However, he tended to be impatient and listen to what others said. This acquaintance, in my opinion, never became successful because of a lack of discipline in implementing his ideas. I have developed the discipline to go to the markets every day and fight a battle, managing complications while staying focused and disciplined. I do that every day and I believe that's what it comes down to: you just have to go and follow through with your plan, day in and day out. That's what separates successful traders from those who would like to be, but are always just following others.
- Please tell us how you came up with the idea to develop your Bollinger bands.
John Bollinger: Bands have generally been plotted on charts since the 1930s. The emphasis here is on "plotted"; so this was done by hand for many decades. For this reason, everything had to be very simple, otherwise it would have been unworkable. I remember the story of a trader named Wilfried Lideaux who in the 1930s put very simple bands on the highs and lows of an index. The whole thing was similar to a trend channel and was based on monthly data. He used these bands to make his buy and sell decisions for swing trades. As far as I can remember, he called his strategy the "Twinline Trading System". Later, bands were manually aligned based on moving averages. You can see an example of this in Figure 1, which simply calculates a moving average over, say, ten periods, and then shifts it up and down by a certain percentage. This variant of calculating bands is now called Moving Average Envelopes, or Envelopes for short. Anything within the bands can be interpreted as normal market noise, and only when the bands are touched or crossed are there significant deviations. However, there is a big problem with these simple bands: what percentage in the shift is the right one? Psychological aspects creep in here, because traders can always align the bands in a way that fits just fine. So there is a lack of an approach to automatic standardization and scaling.
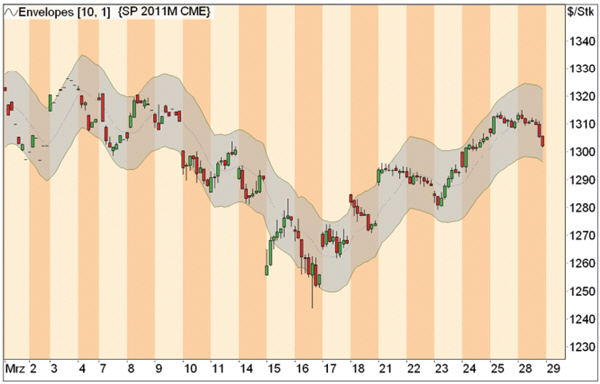
Simple Bands (Envelopes)
Figure 1 shows the S&P 500 Future with simple envelopes. The bands are created by shifting a moving average (dashed center line) up and down by a certain percentage. Here we used a GD over ten periods, shifted by one percent each time.
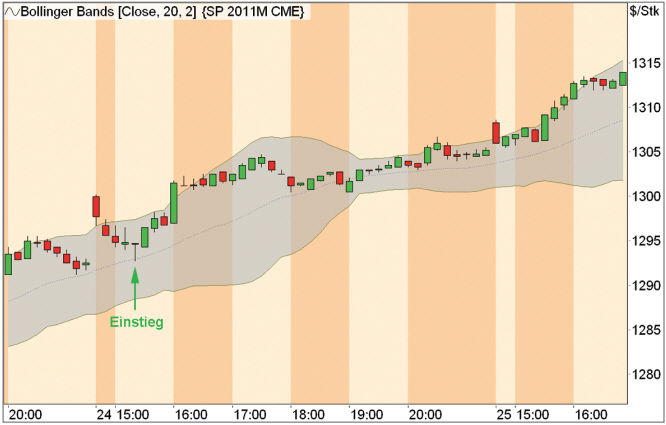
Trade at the centre line
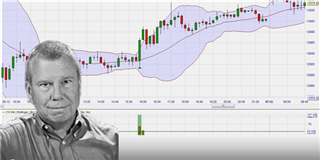
Figure 2. Here you see a nice opportunity for an intraday trade. The S&P 500 future returns to the midline of the Bollinger bands (i.e. the 20-period GD) after a strong opening. A hammer forms there on the 10-minute chart, which confirms the centre line as support and offers a nice entry point for a long trade
- Why are the Bollinger bands better?
John Bollinger: I introduced scaling based on standard deviation with the Bollinger bands. That may seem off ensible from today's point of view, but it was not so at that time. I can remember that many people assumed that it was. The standard deviation is a well-known statistical measure that describes the distribution of data around its mean. In the default setting of the Bollinger Bands, a 20-period moving average is used and two times the standard deviation is plotted up and down each period. The 20-period moving average represents the center line in the indicator, and the upper and lower bands are created by taking off twice the standard deviations.
As the volatility in the market is constantly changing, the width of the bands also changes. So when things are calm and prices fluctuate little, the bands are close together. In turbulent times, on the other hand, they quickly widen. Basically, this is an automatic adjustment to market conditions. This is important because volatility is by no means linear, but occurs in so-called "clusters". Volatility is therefore itself volatile, but can be above average or low over a longer period of time. Incidentally, Robert Engle and Clive Granger won the Nobel Prize in 2003 for their research, which is essentially based on the basic observation that volatility is volatile.
Traders can set the multiple by which the standard deviation is shifted up or down on the Bollinger Bands. I chose a value of two, because that is how about 95 percent of all price movements should occur within the bands. The higher the multiple is chosen, the less likely it is that one of the bands will be violated. So, apart from the multiple of the standard deviation, everything is calculated automatically. Thus, as a trader, you can hardly "talk your way around" the chart. In addition, the Bollinger bands show on a relative basis whether the price is currently quoted high or low. Of course, interpreting this is a different story.
- What do you mean? Do some traders misinterpret the bands?
John Bollinger: Some people make it too easy and think that the violation of the upper band is automatically a sell signal and the violation of the lower band is a buy signal. This is of course wrong and contradicts the basic idea just mentioned. As I said, the bands show relative reference points to determine whether prices are currently high or low. However, there are trends in the markets, as we all know. So, prices can be relatively high (uptrend) or relatively low (downtrend) for a long period of time. For this reason, interpreting the bands is a different story, as the chart picture must be put into context. So while reaching the lower Bollinger band within an established sideways market can be a nice buy signal, the same signal within an overarching downtrend can be the trigger for a momentum short trade.
- And how can traders tell if there is a trending market?
John Bollinger: For this, traders should consult other indicators. The Average Directional Movement Index (ADX) developed by Welles Wilder is particularly suitable for this. In addition, the Bollinger Bands can be combined well with the Moving Average Convergence/Divergence (MACD), or with an indicator that shows the slope of any moving average.
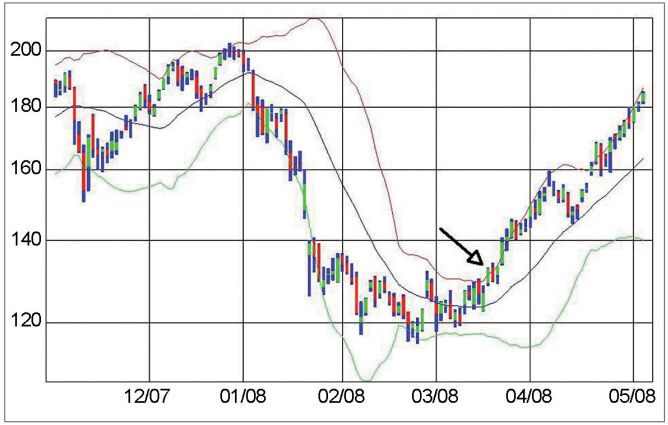
W Bottom for the S&P 500
Figure 3 shows the chart of the S&P 500 from December 2007 to June 2008, with the Bollinger bands and the %b indicator plotted. While the market reaches new lows in March 2008, this movement is not confirmed by the %b indicator. This offers a good long entry. Such divergences belong to John Bollinger's favorite setups.
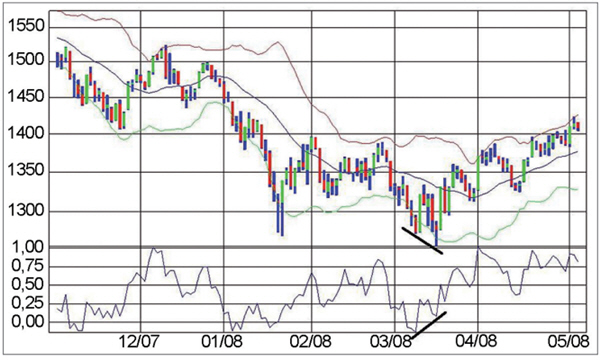
Figure 4. Here you can clearly see that a breakout of the upper band does not have to be a sell signal by any means. It can just as well be a buy signal, especially with strong stocks like Apple (breakout in March 2008).
Bollinger %b indicator
This indicator, developed by John Bollinger, describes the position of the closing price in relation to the Bollinger bands in the standard setting (GD over 20 periods, shift by two standard deviations each). Values between zero and one are within the bands. Values below zero indicate prices below the lower band, values above one indicate prices above the upper band. According to Bollinger, in addition to the location of the closing price, the thickness of the bands is also important for analysis.
- What setting do you recommend for the Bollinger bands?
John Bollinger: The default setting, as I said, is a moving average over 20 periods plus/minus twice the standard deviation. In principle, of course, these parameters can be varied. Over the years, I have found that in short-term trading, for example, it makes sense to choose a shorter value for the moving average so that the Bollinger bands are even more responsive to rapid trend changes. However, for the beginning the default setting is ideal and many traders keep it in later use.
- Can you recall any exceptionally large gains in your trading career?
John Bollinger: I have been trading full time since 1980 and have made countless trades. I can remember a few big wins and losses, but not in detail. I used to trade options a lot and that's where various gains of several hundred percent occurred. However, I always held several positions in a portfolio, so the overall performance was never extremely bad or good. Today, my trading focuses mainly on equities, although I don't specialize in US stocks here, but look for opportunities worldwide.
- Can you tell us about your concept of "Rational Analysis"? How does it differ from Technical and Fundamental Analysis?
John Bollinger: First of all, both Technical and Fundamental Analysis are very valuable. However, there is a kind of intellectual war between the two disciplines - one side simply cannot and will not understand the other. This divide is obviously a hindrance when it comes to finding good setups for trading. In the end, it's all about picking the best opportunities, and for that you should look at all forms of analysis. For example, you could also do a technical analysis of the fundamentals. So if we have time series on this data, why not just do a chart analysis on it or put in a moving average? By the way, today, in addition to Technical and Fundamental Analysis, there is Behavioral Analysis as well as Quantitative Analysis. When I first developed the concept of Rational Analysis, these two new types of analysis methods did not yet exist. So, all in all, four dimensions of analysis can be included in trading. As a result, it is also necessary to see and classify all these perspectives in a relative view to each other, which is perhaps the greatest achievement of the trader himself. Altogether, I call Rational Analysis, because one does not stick to one method of analysis, but reasonably includes all perspectives.
- How do you implement the combination of different forms of analysis?
John Bollinger: I like to combine fundamental and technical analysis by setting up at least a two-step process for finding my trading decisions. First, I use a screener that helps me identify the stocks with the best ratios for me based on a variety of criteria. With this fundamental-quantitative approach, I can reduce the initially unmanageable universe of stocks to just a few. In the second step, I look at the stocks selected in this way and then trade them according to technical conditions. At this point, I can also include mass psychological aspects if necessary, so that I have incorporated all four methods described in my analysis method.
- What is your personal trading edge?
John Bollinger: As I mentioned earlier, I think discipline is critical. One of my mentors in the early days once told me that you have to develop and apply a good system and stick with it. There are many different ways and systems you can be successful. A true winning guy not only knows this, but he continually acts on it - day in and day out. That's what most people don't manage to do. So I think it's a big advantage in my trading that I've been doing this for 31 years.
In addition, of course, it's an advantage that I've now acquired a great deal of knowledge about all sorts of technical and fundamental analysis topics, which is always helpful in my trading decisions. I have read many old books and learned from the old masters of trading. Many of these techniques are forgotten today, but some of the ideas can be really valuable.
- What role does order volume play in your trading?
John Bollinger: I like to use volume a lot. Many indicators can be calculated in a volume-weighted way, and that's how I prefer to use them. The advantage of this is that volume is information that doesn't have to be directly related to price. However, the indicators that are calculated from the prices are always directly related to the price. For this reason, it is also problematic to use many indicators with the aim of filtering out the best trades. The problem is called "multicolinearity" in science. So, if I use one momentum indicator to "improve" the signal of another momentum indicator, it brings practically nothing at all, except additional confusion. So one should use few and largely independent indicators and volume is excellent from this point of view. However, I know few people who include volume comprehensively, which I don't really understand.
- So you are a systematic trader on the one hand and a discretionary trader on the other?
John Bollinger: I would say that I am equal parts both. On the one hand, I do quantitative screenings, and on the other hand, I select my actual trades by hand. This combination of filtering technique and intuition is very useful for me. This way, the weaknesses of both methods can be more or less eliminated from each other.
- Do you combine your Bollinger bands with relative strength approaches?
John Bollinger: I'm really a fan of relative strength strategies. By relative strength, I don't mean the Relative Strength Index (RSI), but rather the actual Levy Relative Strength (RS) of a stock versus the market. As a rule, I select my stocks according to this method. Particularly interesting are constellations in which a stock with high Relative Strength moves into a consolidation and then breaks out again to the upside within a small channel. Sometimes I also look at news. For example, if the stock is consolidating and bad news is announced that the stock doesn't fall on or barely falls on, that is a very bullish sign.
- What do your risk and money management look like?
John Bollinger: I basically follow a portfolio approach. This means that I diversify my positions and thus distribute the overall risk. I also take very little risk per trade in relation to the overall portfolio. Once I have opened a position, I do not expand it further later. So I do not use a pyramidization technique. When I exit, I may do it gradually if my position is far in the plus. Sometimes I also turn my positions directly from long to short or vice versa. However, I do all this on a discretionary basis.
Divergence in Merck & Co (MRK)
Figure 5 shows the chart of Merck & Co from October 2007 to June 2008 with the Bollinger Bands and the Intraday Intensity Index over 21 periods. When prices touched the upper Bollinger Band in August 2008 and the Intensity Index diverged significantly from the last high in July, a good opportunity for a short trade presented itself.
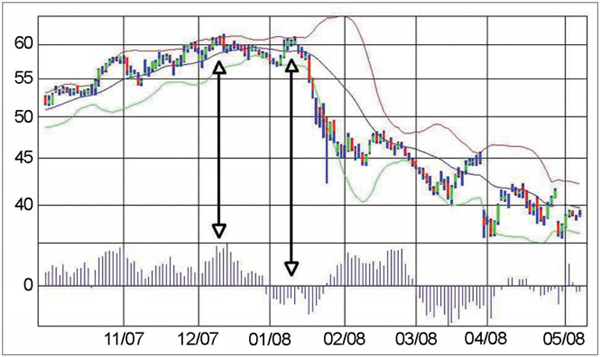
Intraday Intensity Index (III)
This volume-based indicator shows where the big money is going in a security. This is measured by the ratio of the closing price to the high-low range of the day.
Formula: III = ( 2 x Close - High - Low ) / ( High - Low ) x Volume.
- Which order types do you use?
John Bollinger: I basically only use limit orders for my buy and sell orders. By the way, I rarely use stops that are in the market, but trust my discretionary exit decision.
- How has your performance changed in recent years?
John Bollinger: The last few years have been very good, I can't complain. Overall, my performance developed pretty steadily.
- Do you have a fixed daily trading routine?
John Bollinger: No, there is no fixed plan. I trade in the medium-term range and don't necessarily have to be there at fixed times, as my average holding period is in the range of several months. I do short term trades of course, again and again I like to do intraday trades - but here I use very small position sizes as it is not the main aspect in my trading.
- In which phases do drawdowns occur in your strategy?
John Bollinger: I trade predominantly on the long side of the market. Therefore, it always gets difficult for me in big bear markets.
- How do you assess the psychological aspect of trading?
John Bollinger: The psyche is crucial in trading. To put it in a nutshell, I would say that trading is nothing more than a psychological game with oneself.
- What tip do you have for trading beginners?
John Bollinger: Here I can pass on the advice I once received myself, which helped me a lot: Do your own analysis and backtesting and develop a system that works. Then you just need to stick with it and follow through day after day.
- Would you like to stop trading at some point?
John Bollinger: I think I can answer succinctly here: No, not at all!
People also read
How to trade the volatility of crude oil
Trading the DAX with J. Welles Wilder's Parabolic SAR
Free demo

Trading videos
Charting, strategies, automated trading, backtesting, playback... watch these videos and become a platform master.

Broker
WH SelfInvest serves traders from offices in Germany, France, Switzerland, Belgium, Luxemburg and the Netherlands.
The spectacular SignalRadar
SignalRadar shows live trades being executed by various trading strategies.
More ...
- 1 of 5
- next ›