Test NanoTrader Full I Test Tradingview I Test the mobile platforms All for CFD-Forex & Futures
You are here
Keltner Trend Pullback, a trading strategy
This trading strategy combines the well-known Keltner channels with the concept of a pullback. A market which is in a trend but which moves in the opposite direction is said to be in a pullback. Traders expect this pullback to be only temporary and expect the market to resume its trend. Chester Keltner was a grain a trader in Chicago who introduced the concept of channels in his book ‘How to make money in commodities’ published in 1960.
| Suitable for | : Market indices (DAX, CAC, DOW...) : Stocks, forex, commodities |
| Instruments | : Futures, CFD, forex |
| Trading type | : Day trading |
| Trading tempo | : 1-3 signals per day |
| Using NanoTrader Full | : Manual or (semi-)automated |
THE STRATEGY IN DETAIL
The Keltner Trend Pullback strategy can be used on all markets. It tends to be used in small time frames such as 1-minute, 3-minute and 5-minute charts.
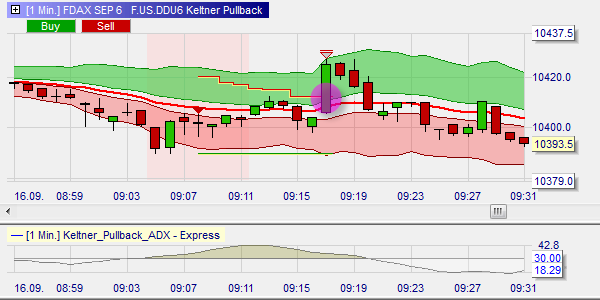
In order to determine if the market is in a trend, the strategy uses the ADX. For a signal to appear the ADX must be > 30. When the ADX is < 30 signals are ignored.
This example shows the ADX. When the ADX is > 30 the surface below the ADX line is coloured. In this case the market is in a trend and trading signals can appear.
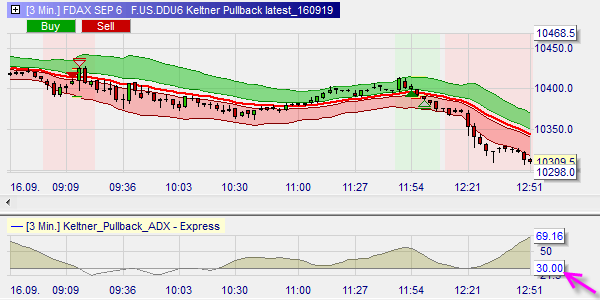
The Keltner channel is calculated around a moving average. This is the red, central line in the example above.
The strategy also contains a time filter. The time filter rejects all signals after 20h00.
WHEN TO OPEN A POSITION?
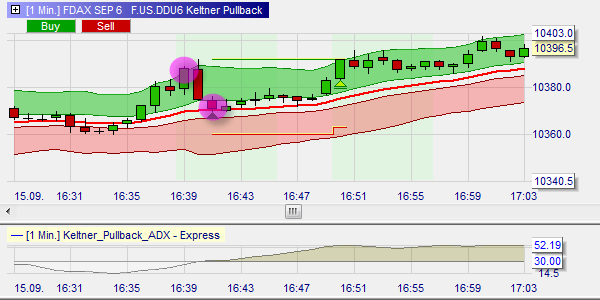
First the market needs to close above, in the case of a potential buy signal, the Keltner channel. If, within six periods, the market drops back to the narrow channel around the red moving average (a pullback), a buy signal appears.
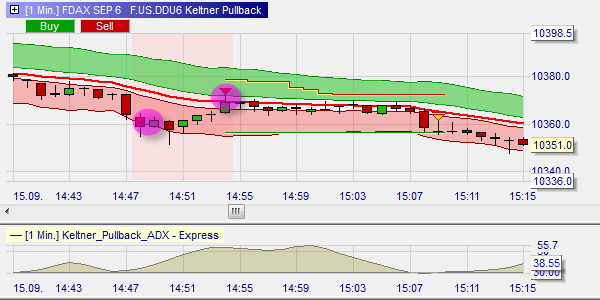
In the case of a potential short sell signal, the market first needs to close below the Keltner channel. If, within six periods, the markt moves up again to the narrow channel around the red moving average (a pullback), a short sell signal appears.
This example shows a buy signal. The market price closes above the Keltner channel, turning the background of the chart green. Only 2 periods after the last close above the channel, the price pulls back within the narrow channel and a long position is bought.
This example shows a short sell signal. The market price closes below the Keltner channel, turning the background of the chart red. Only 5 periods after the last close outside the channel, the price pulls back within the narrow channel and a short sell position is sold.
WHEN TO CLOSE A POSITION?
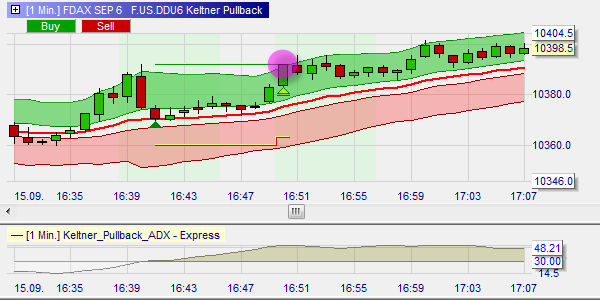
The Keltner Trend Pullback strategy uses a profit target and a stop to protect the position. The target is the high of three periods back. The stop is a periods high-low stop calculated over 15 periods. The nature of the periods high-low stop is that it will trail the open position if the trade evolves in the right direction.
This example shows a long position. The green line is the profit target; the red line is the periods high-low stop. This position reaches the profit target.
This example shows a short sell position. The green line is the profit target; the red line is the periods high-low stop. This short position is stopped out.
CONCLUSION
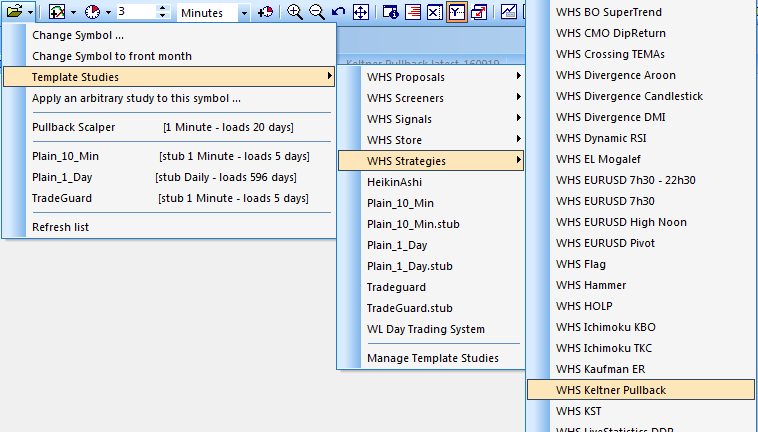
The Keltner Trend Pullback strategy is traded in a time frame of 5 minutes or less. The number of signals is nevertheless very manageable. This free trading strategy can be found in the WHS Strategies folder in the NanoTrader.
Free demo

Trading videos
Charting, strategies, automated trading, backtesting, playback... watch these videos and become a platform master.

Broker
WH SelfInvest serves traders from offices in Germany, France, Switzerland, Belgium, Luxemburg and the Netherlands.
The spectacular SignalRadar
SignalRadar shows live trades being executed by various trading strategies.
More ...
- 1 of 5
- next ›