Test NanoTrader Full I Test Tradingview I Test the mobile platforms All for CFD-Forex & Futures
You are here
The MACD Zero Line indicator signal
The MACD is a popular technical analysis indicator. It is a component in many trading strategies. But... there are two ways different ways in which to intepret the MACD indicator. This has resulted in two camps with different opinions. The MACD Zero line indicator unites these two camps. It combines the two interpretations into one signal.
The MACD Zero Line indicator
Two ways of intepreting the MACD
MACD (Moving Average Convergence Divergence) is a trend-following indicator. It calculates the relationship between two moving averages. This results in the MACD line. This line is usually shown in a separate window, below a chart.
As the two moving averages converge or diverge, the MACD line fluctuates above and below zero. Usually, a moving average based on the MACD itself is also calculated and shown. This line indicates when the trend changes. It is used as a signal line.
The two classic MACD interpretations are therefore:
- A zero line crossover. When the MACD crosses above the zero line, the market is bullish. This is a buy signal. A cross below is bearish and a short sell signal.
- A signal crossover. When the MACD crosses above the signal line, the market is bullish. This is a buy signal. The reverse interpretation for a cross below the signal line.
Two opinons united in one solution
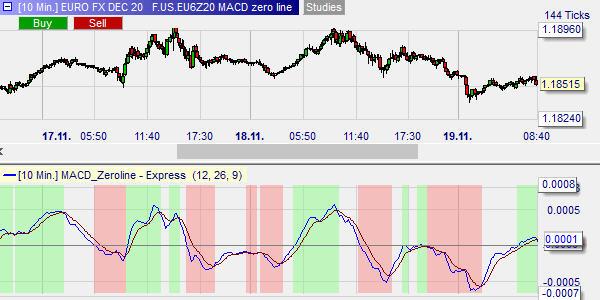
The MACD Zero line combines these two MACD interpretations in one trading signal. The conditions for a signal are:
- For a long signal the MACD must cross above the signal line while the MACD is above zero OR the MACD must cross above the zero line while the MACD is above the signal line.
- For a short sell signal the MACD must cross below the signal line while the MACD is below zero OR the MACD must cross below the zero line while the MACD is below the signal line.
This illustration the MACD zero line indicator below a chart of the EUR/USD forex pair. The background is coloured in green (long signal) or red (short sell) when both conditions are met.

People also read
- Trading based on the Parabolic SAR indicator
- Trading the DAX with J. Welles Wilder's Parabolic SAR
- The Traders Dynamic Index indicator (TDI)


