Test NanoTrader Full I Test Tradingview I Test the mobile platforms All for CFD-Forex & Futures
You are here
A new technical analysis indicator: the Hi-Lo tool
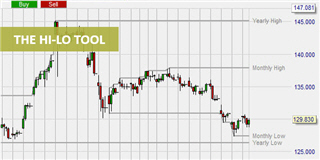
For some traders, charting tools such as the Fibonacci retracement can be a little complex to identify support and resistance levels. With NanoTrader's Hi-Lo tool, identifying support and resistance levels across multiple time frames has become easier and more efficient.
The advantages of the Hi-Lo tool:
- Ideal for traders working with support and resistance.
- The highest and lowest price points are easily visible.
- It can be easily applied to all tradable instruments.
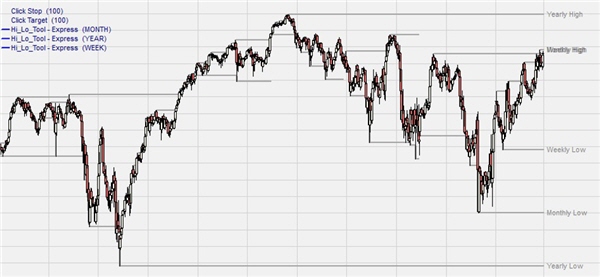
- It can be used to show highs and lows for multiple time levels on the same chart.
- The highs and lows are well marked on the chart.
The Hi-Lo tool is a new technical indicator available in the NanoTrader platform. As the name suggests, the Hi-Lo tool helps traders identify the highest and lowest point reached by an asset's price during a specific time frame. You can also use this indicator to compare the highest and lowest price points across multiple time frames.
What does the Hi-Lo tool do?
The Hi-Lo tool is helpful in identifying support and resistance levels. These are essential for both short-term traders and position traders, especially when using limit orders. The highs represent resistance levels and the lows represent support levels. These levels are also useful in setting the ideal stop loss and take profit levels.
Since no technical trading strategy is foolproof, you should always use the existing stop functions in NanoTrader to limit your losses. Any resistance level or support can be broken at any time.
It is also more effective to consider the Hi-Lo tool under several time frames to identify entry and exit points. This is because most technical indicators generate delayed signals when forming a signal.
Long trades using the Hi-Lo tool
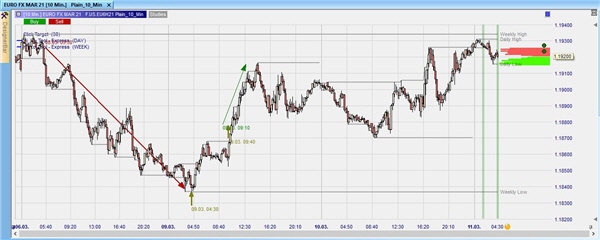
Bullish signals from the Hi-Lo tool can be generated in two ways. First, if the price action breaks the previous highs and continues the trend upwards, this can be considered a bullish signal as the highs are interpreted as resistance levels. You can see an example in Figure 2 (at 9.40 am on 9 March).
You can also use the previous daily highs to set buy stop orders, while the previous weekly highs can be used as take profit levels.
Zweitens, wenn sich der Markt in einem allgemeinen Abwärtstrend befindet und der Preis von den Tiefstständen - dem Unterstützungsniveau - abprallt, kann man davon ausgehen, dass sich der Trend in einen Aufwärtstrend umkehrt. In diesem Fall können Sie frühere Tagestiefststände nutzen, um Kauf-Limit-Orders zu setzen. Ein Beispiel sehen Sie in Abbildung 2 (9. März um 4.30 Uhr).
Figure 2: EURO FX, 10-minute chart, 6 to 11 March 2021.
Short sell trades with the Hi-Lo Tool
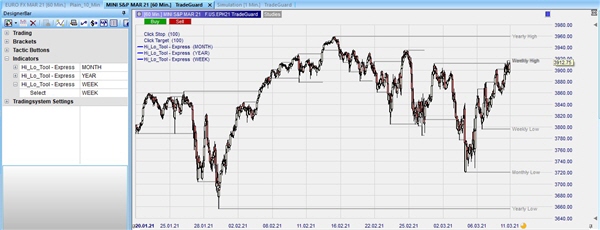
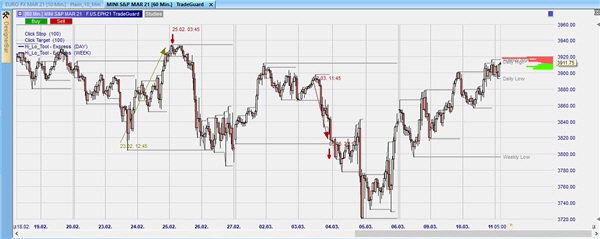
The lows identified by the Hi-Lo tool can be used as support levels. If the price movement breaks the support level and trends below it, this is seen as an increase in bearish momentum and represents an opportunity to go short. This level can also be used to place sell stop orders. This can be seen in Figure 3 at 3.45 am on 25 February.
An opportunity for a short trade also arises when the price bounces off the highs formed by the Hi-Lo tool in an uptrend. This shows that the uptrend has weakened and is reversing into a downtrend. This level can also be used to set sell limit orders. You can see an example in Figure 3 (at 11.15 a.m. on 3 March).
Figure 3: Mini S&P 60-minute chart, 18 February - 11 March 2021.
Fazit
With NanoTrader's Hi-Lo tool, identifying support and resistance levels across multiple time frames has become easier and more efficient. The trader only needs to select a time frame in which he wants to trade and the Hi-Lo tool draws the matching support and resistance levels.
People also read
The Daily Dax trading strategy
How John Bollinger invented the Bollinger Bands and more
Free demo

Trading videos
Charting, strategies, automated trading, backtesting, playback... watch these videos and become a platform master.

Broker
WH SelfInvest serves traders from offices in Germany, France, Switzerland, Belgium, Luxemburg and the Netherlands.
The spectacular SignalRadar
SignalRadar shows live trades being executed by various trading strategies.
More ...
- 1 of 5
- next ›