Test NanoTrader Full I Test Tradingview I Test the mobile platforms All for CFD-Forex & Futures
You are here
Price forecasting using Elliott waves
Elliott waves are very controversial in technical analysis. Some consider them to be nonsense, while others hail them as a miracle solution and an essential forecasting tool. Indeed, it is not easy to master Elliott waves, to count and assess them correctly, because they have a certain subjective component that makes it difficult for some to deal with. They are certainly not suitable for computer-controlled, systematic trading, but with the right intuition they can certainly tip the scales in a trading decision.
There are very successful traders who make their decisions based on the Elliott Wave Theory. For a while it was thought that Elliott waves or a further refinement could be the key to deciphering the order in the markets. This has since been discarded, but ultimately one should be familiar with the fundamentals of this theory, because it is actively used by other market participants, which in turn drives prices.
Price forecasting using Elliot waves
From Mr. Elliott to the waves
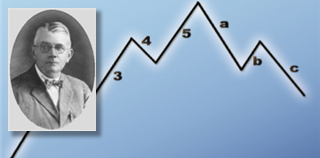
It all started in the 1930s with a certain Mr Ralph Nelson Elliott, an early retired accountant with a penchant for numbers, charts and the Dow Jones. He was a great believer in the Dow Theory and had a lot of time to study this very subject in detail. Accordingly, the Elliott Wave Principle is also often regarded as an extension or supplement to the Dow Theory. In 1946, a book with the very modest title "Nature's Law - The Secret of the Universe" (Elliott's definitive work on the wave principle), was finally published. Despite the appealing title, his ideas received no further attention. It was not until 1980 that Robert Prechter published "The Major Works of R. N. Elliott" and thus helped the theory surrounding Elliott waves to gain recognition. Finally, they were included by John J. Murphy in the undisputed reference work "Technical Analysis of Financial Markets". They have since been included in technical analysis, just like the Dow theory.
Five times up, three times down
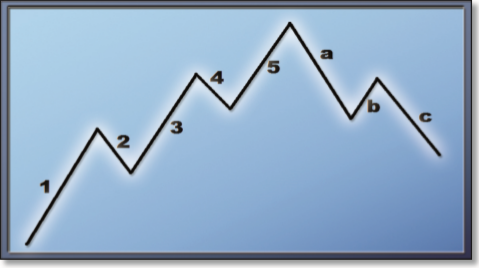
The theory basically states that the stock market is in a constant rhythm of five rising and three falling, corrective waves - regardless of the time frame under consideration. The basic pattern in Figure 1 shows this eight-wave basic cycle. Waves 1, 3 and 5 are called impulse waves and waves 2 and 4 are called corrective waves. The three falling waves a, b and c are the opposite. This brings us to another striking feature, which makes a lot of sense when applied to any chart: Each impulse or correction wave can, in itself, consist of five or three "smaller" waves. Thus, ideally, one can start counting waves on a one-minute chart in order to find the ultimate waves later on an annual chart.
Figure 1. The basic cycle. This is the elementary price pattern of the Elliott wave theory: impulse 1, correction 2, impulse 3, correction 4, impulse 5 - high point - impulse a, correction b, impulse c.
The link to Fibonacci
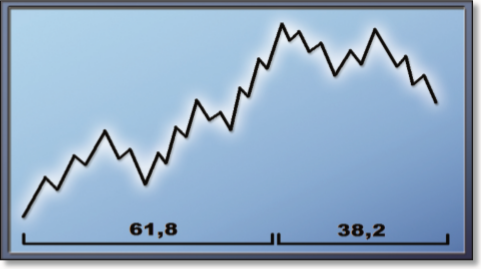
Another amazing fact about counting waves is that any wave cycle always consists of Fibonacci numbers. If you start at the smallest sub-cycle of a single split corrective wave, you count one rising wave and two falling waves, giving a total of three. Adding the five previous waves gives eight. Assuming that each impulse wave has five waves and each correction wave has three waves, this results in 34 individual waves for a completely split basic cycle, which in turn - surprise, surprise - consist of 21 and 13 waves. This means that the first eight elements of the Fibonacci number sequence are in place. Of course, it is possible to count up to 144 without any problems, this is in the nature of the waves. With the help of vertical Fibonacci projections, similar to the horizontal Fibonacci retracements, it is also possible to predict the appearance of the next wave, because the time sequence, according to the ideal theory, also follows this basic pattern (Figure 2).
Figure 2: Fibonacci and Elliott. According to the theory, the five upward waves and the three downward waves should have an ideal ratio of 1:1.682 to each other. Moreover, this plot counts exactly 34 (21+13) waves.
Counting is not easy
In practice counting Elliott waves is not easy. Here you are confronted with the problem that not every chart moves in optically obvious, perfect waves. A basic rule among Elliott Wave analysts is that you can only really tell which wave it was after it has ended.
In an established uptrend, for example, the question often arises as to whether a present bullish movement represents impulse wave 3 or 5. However, there are some tools for the correct identification of waves. These are the patterns described in detail in the Elliott Wave Principle. Triangles, zig-zags and flats are the three classes of corrective waves. Each of these are visual patterns (Figure 3) that are easy to understand once you know what they look like.
Irregularities can occur with these patterns (waves that do not run all the way to or further than the expected point), which increases the room for subjective opinion. Nevertheless, these patterns often conceal reveal information, because they allow corrective waves to be found and, if possible, assigned. In this way, a whole cycle can be identified.
Careful attention must be paid to the fact that theoretically every wave can be irregular in terms of length, high and low points or classification in the cycle. This makes it difficult to correctly identify wave patterns, let alone use them to make forecasts. If the market reacts differently than expected, this may again be related to irregularities or "miscounting". But if you get it right, the pay-off can be huge.
Figure 3. On the left the Zig-Zag, in the middle a symmetrical triangle, on the right a flat. These chart patterns are associated with corrective waves.
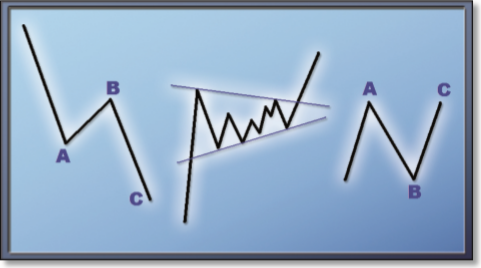
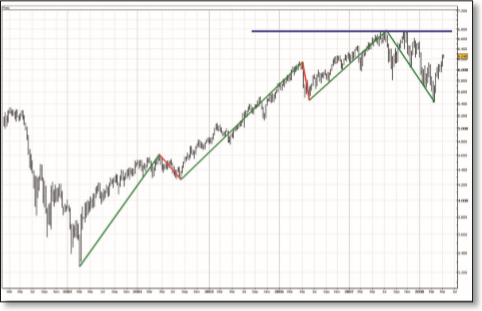
Figure 4: Elliott wave analysis. This chart shows the FTSE 100 on a weekly basis. The long upward movement suggests a five-wave cycle. However, according to the temporal Fibonacci law, the correction would have to last until about the end of 2009, so at the moment it can only be impulse wave a.
Conclusion regarding price forecasting using Elliott waves
All in all, the Elliott Wave Theory is a fairly exotic approach that, strictly speaking, fails because it assumes a fundamental order to the markets and then only succeeds in finding this order through far-reaching definitions and free spaces. Thus, the idea of order is partly subjective.
Nevertheless, this theory ultimately has enough points of reference to set up some solid analyses (or to corroborate other analyses that are perhaps based on other concepts of technical analysis). Through the interaction of wave cycles and the occurrence of formations, the Elliott Wave Principle creates an certain inner confidence. It is by no means the ultimate in technical analysis, but it is a piece of the puzzle.
If you are looking for a good managed account, check out this regulated service...
People also read
- The secret king of chart patterns: The Wolfe Wave
- Trading based on the Parabolic SAR indicator
- The 1-2-3-4 chart pattern
“Although few would admit it, the truth is that the typical trader wants to be right on every single trade. He is desperately trying to create certainty where it just doesn’t exist.”
- Mark Douglas
Free demo

Trading videos
Charting, strategies, automated trading, backtesting, playback... watch these videos and become a platform master.

Broker
WH SelfInvest serves traders from offices in Germany, France, Switzerland, Belgium, Luxemburg and the Netherlands.
The spectacular SignalRadar
SignalRadar shows live trades being executed by various trading strategies.
More ...
- 1 of 5
- next ›