Test NanoTrader Full I Test Tradingview I Test the mobile platforms All for CFD-Forex & Futures
You are here
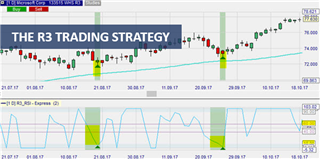
The R3 trading strategy
The R3 trading strategy was developed by the well-known trader Larry Connors. The strategy first appeared in his book "High Probability ETF Trading". Although Connors developed this strategy with a very high hit rate for ETFs, the general principles can be applied to other financial instruments as well.
Larry Connors' main goal was to develop a strategy where there are more winning trades than losing trades.
Advantages of the R3 trading strategy:
- It is versatile and thus applicable for all instruments
- Helps define entry points
- Can be used for manual or (semi-)automatic trading
The R3 trading strategy in detail
Based on his research and experience, Larry Connors became a big fan of the 2-period RSI indicator. The R3 strategy is a mean reversion strategy that mainly uses the 2-period RSI. The general idea is to find a good entry point after a mean reversion when the 2-period RSI enters the extreme overbought (oversold) area, while the general trend direction remains intact.
When is a position opened?
Trader Larry Connors uses four criteria to obtain a trading signal. Three of these criteria include the RSI, hence the name R3.
A buy signal is appears when:
- The market price is above the 200-day moving average
- The 2-period RSI falls three days in a row
- On the first day of the three-day decline the RSI value is already below 60
- The 2-period RSI of the current day closes below 10
A short sale signal appears when:
- The market price is below the 200-day moving average
- The 2-period RSI rises three days in a row
- On the first day of the three-day rise the RSI value is already above 40
- The 2-period RSI of the current day closes above 90
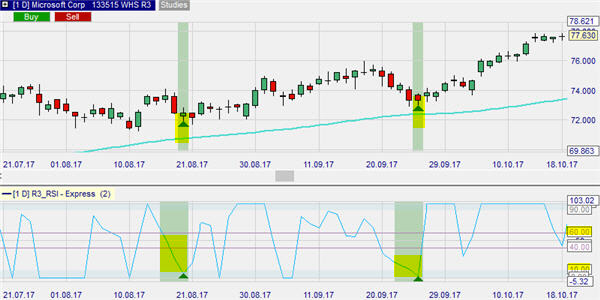
The following example shows two buy signals for the Microsoft share. The market price is above the blue line, which is the 200-day moving average on the chart. The RSI was below 60 when it started to fall for three consecutive days. After the RSI fell below 10, a buy signal was triggered.
When is a position closed?
The R3 strategy does not use a profit target or a stop loss.
On the other hand, a position is closed when:
- A long position is closed when the 2-period RSI closes above 70
- A short position is closed when the 2-period RSI closes below 30
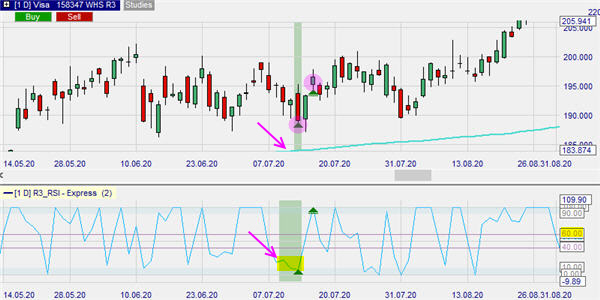
The following example shows a buy signal for the Visa share. The position was automatically closed 2 days later when the RSI closed above 70.
Convincing results in the backtest
Backtests give a very good impression of the R3 strategy. In particular, Larry Connors' claim that the strategy has a high number of winning trades seems to be correct.
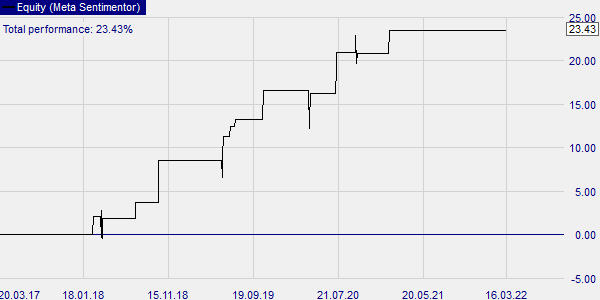
The following example shows a backtest of the Visa share over a period of five years. There were a total of 12 signals (9 winners and 3 losers). The total gain was 23.4%. The best winning signal brought +4.6%. The worst losing trade lost -0.25%.
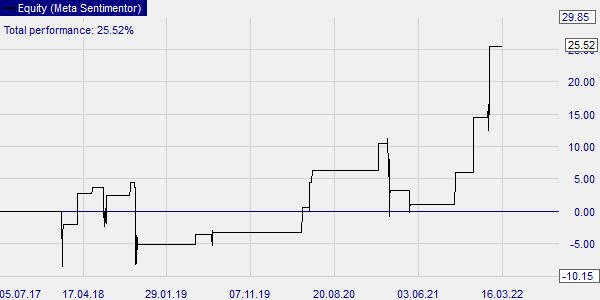
Another example shows a backtest of the NVIDIA share over a period of five years. There were a total of 17 signals (12 winners and 5 losers). The total gain was 25.5%. The best winning signal brought +9.6%. The worst losing trade lost -9.2%.
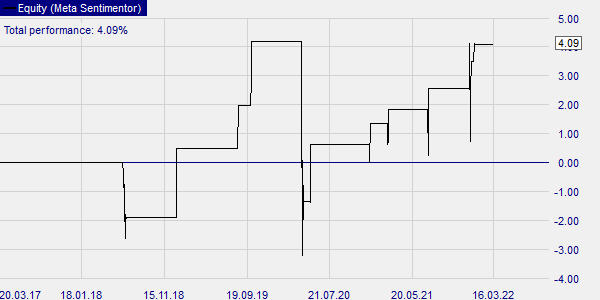
Our third example shows a backtest for the S&P 500 index over a five-year period. There were a total of 11 signals (9 winners and 2 losers). The total gain was 4.1%. The best winning signal brought +2.4%. The worst losing trade lost -5.3%.
Conclusion
The R3 trading strategy is a strategy for successful maximization of winning trades, which has a high hit rate and achieves good results in the backtest. It can be used in WH SelfInvest's NanoTrader for both manual and (semi-)automatic trading.
People also read these trading articles
Free demo

Trading videos
Charting, strategies, automated trading, backtesting, playback... watch these videos and become a platform master.

Broker
WH SelfInvest serves traders from offices in Germany, France, Switzerland, Belgium, Luxemburg and the Netherlands.
The spectacular SignalRadar
SignalRadar shows live trades being executed by various trading strategies.
More ...
- 1 of 5
- next ›