Test NanoTrader Full I Test Tradingview I Test the mobile platforms All for CFD-Forex & Futures
You are here
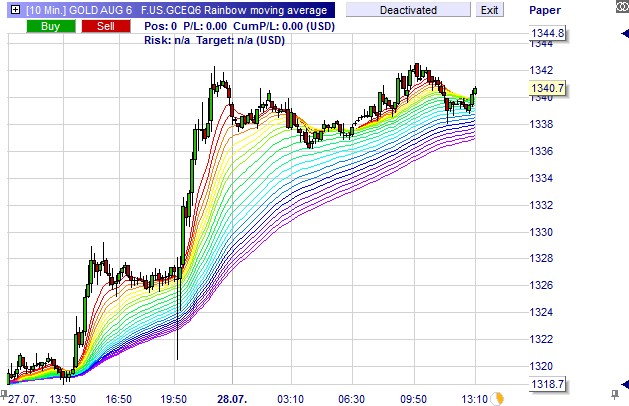
The Rainbow indicator
The Rainbow Moving Average indicator is based on Australian trader Daryl Guppy's Rainbow indicator. The Rainbow Moving Average indicator consists of 22 exponential moving averages (EMA) ranging from 9-period up to 100-period EMAs. These 22 EMAs are plotted on the price chart using the full colour spectrum which makes the indicator look like a “rainbow”. But it’s not just about esthetics – the rainbow indicator is very useful in highlighting trend changes. It was popularized by trader Lars Gottwik in the Godmode trader forum.
The Rainbow indicator can be applied on any instrument and in any time frame.
People also read
The 1-2-3-4 chart pattern by Jeff Cooper
Trading the DAX with J. Welles Wilder's Parabolic SAR
Free demo

Trading videos
Charting, strategies, automated trading, backtesting, playback... watch these videos and become a platform master.

Broker
WH SelfInvest serves traders from offices in Germany, France, Switzerland, Belgium, Luxemburg and the Netherlands.
The spectacular SignalRadar
SignalRadar shows live trades being executed by various trading strategies.
More ...
- 1 of 5
- next ›