Test NanoTrader Full I Test Tradingview I Test the mobile platforms All for CFD-Forex & Futures
You are here
The right exit

This article explains how to handle exits correctly in a simple trading system. The system used for this purpose is a robust trend following strategy, which is available in many trading platforms, so that the techniques shown here can be understood by the reader.
Today, the industry offers many possibilities on the subject of trading. Numerous software products make it easy for traders to enter into the subject. The main focus is frequently on technical analysis and position entry. Exits are usually rather neglected. However, after some time, traders start to understand that the entry is not as important as it seemed in the beginning.
Much more important are the exits, because several parameters are determined with them, for example, whether a profit or a loss is made, how much profit or how much loss is made, which positions correlate with each other and how long they may still be held in the current scenario, profit/time correlations, etc.
If the trader has been intensively involved with exits and understands their importance, then he’s taken the first important step toward generating and increasing profits continuously. This is why we will first see the individual parameters that can be controlled with the right exit, and later we will use some of these parameters in a simple trading system.
PROFIT/LOSS
Figure 1 shows a normal trading day on 03.01.07 in the stock AMLN (Amylin Pharmaceuticals Inc., listed on NASDAQ). The blue triangle shows the long entry around 16:15 CET, 10:15 EST (New York time). Since the trader has gone long, i.e. has speculated on prices rising, and the prices increase steadily, maximum profit is reached around 17:20 CET, only one hour after opening the position. The share price remains in the profit range over the next few hours, until shortly after 20:00 CET when the price suddenly drops. In the following hour, the position can only be closed out with a loss. The scenario presented here demonstrates clearly the importance of controlling the parameters in a trading account. The stock traded here could be closed out by the trader both in plus or minus. In this case, the profit or loss only depends on the time of the exit, but not on the entry. The exit time must therefore be actively chosen by the trader and must not be left to chance. It can also be said that the entry point is of very little importance when considering the scenario described here. In fact, the entry has only a very small influence on a successful outcome. The following consideration illustrates this. Suppose we observe two independent traders trading the following two scenarios. The first trader has decided to enter long and speculates on prices rising.
Figure 1. A normal day.
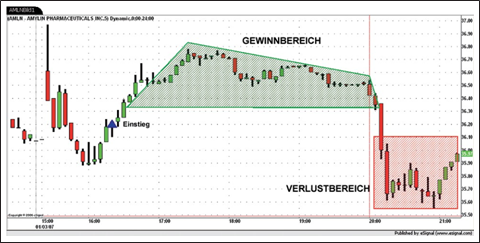

As shown in Figure 1, the long position is taken at 16:15 CET. The second trader trades in the direction of the main trend, but only enters after a retracement. So, this trader opens his short position at 16:15 CET and speculates on prices falling. In this scenario, both traders used a common point, the time of entry. However, both analysed the situation differently and arrived at completely different results. But both traders have opened a position in this stock, one long, the other short. As shown in Figure 1, however, both traders can close their chosen situation with a profit. The trader who has bet on rising prices has a period of almost three and a half hours to 20:00 CET to close out the position in profit.
The other trader, on the other hand, finds himself in a loss immediately after opening his position, so he cannot close his profit immediately, but has to wait until around 20:00 CET to do so. Then, however, he is in a position to close out his position in profit.
The scenario just presented clearly shows that the entry not only has little importance, but that it can be chosen completely randomly. Regardless of how the entry is chosen at 16:15 CET, whether on rising or on falling prices, both entries lead to the correct time of the exit to the profit. It is therefore completely irrelevant whether the respective trader enters the market long or short. This result is only surprising if the assumption is made in advance that the entry is directly linked to the outcome of a trade. For our trading system this insight is of enormous importance, as it has a considerable influence on our stop system.

„Yesterday’s webinar was very good.” – Matt
„For me and some of my neighbours, this is the best talk we've ever heard on trading systems, indicators, etc.” – Will
„The topics were very interesting, all lecturers very competent and I learnt a lot.” – Ewald
„My compliments, it was a great presentation! First class didactics!” – M.U.
But what changes when you decide to trade on rising or falling prices? What can the trader achieve with his analysis? These questions are easy to answer, as only the probability of a hit changes, i.e. the number of attempts to be on the right side immediately when entering a value for the first time increases or decreases. However, it must be clearly stated that a trader does not make a profit with a high probability of a hit alone. It depends rather on the exit, as the above example clearly proves, because both traders are correct during different periods, however, the short trader has a lower probability of a first hit, since his trade turns against him immediately after the opening.
In the worst case, this insight leads to ignoring the entry analysis totally, and in the best case, to considerably reducing efforts for the entry analysis.
Other parameters are much more important. The trader speculating on rising prices is in profit immediately after opening the position. He is thus in a position to realise his profit relatively quickly. The other trader, on the other hand, is in a loss immediately after opening the position and therefore needs a stop that will minimize his loss. We will see how handle with stops further down, but we can already state that a stop which is too close to entry might close the position too quickly, while a stop which the position gives enough space will give the trader more chance to realize his profit at a later stage. The difference between the two traders is therefore the need to use a stop at all. It turns out that the selection of this stop requires much more work than the entry.
Unfortunately, in reality it is repeatedly shown that the effort required for the entry analysis is in inverse proportion to the result. Complex strategies are sometimes used for entry, the development and calculation of which can take a long time, whilst the stop is often set at glance as a percentage of the capital invested, the risk or of the total equity. It should be the other way around.
A simple measure that any trader can take quickly shows where the error lies. Simply measure the time you spend developing and creating the entry rules for your trading system. Then take a look at Figure 2.
Figure 2. The system modules.
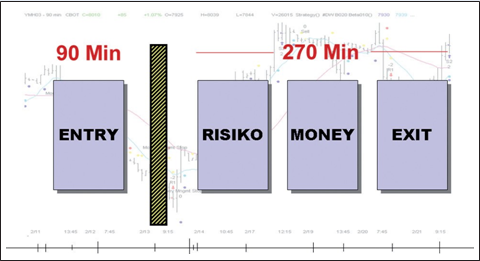

In figure 2 the entry is separated from the other blocks of a trading system by a “wall". This is to demonstrate that the Entryblock has no connection to the profit-making blocks risk, money and profit management.
In this example, the development of entry rules took about 90 minutes. To build a stable system, three times as much time is needed to develop the other three blocks. So, while the development of the entry system took about one and a half hours, it takes almost four and a half hours to stabilize and secure the system.
This immediately shows that the time required for the development of the important parts of a trading system is considerably higher than generally assumed. In the daily work with different traders this error is often shown. Traders often take several days, weeks or even months to develop their entry strategies, sometimes taking the most incredible trips into the most complicated mathematical entanglements, but often end up using only five minutes for stops and risk management. Very simple rules, such as the one-percent rule, are often used.
THE FALLACY OF THE ONE-PERCENT RULE
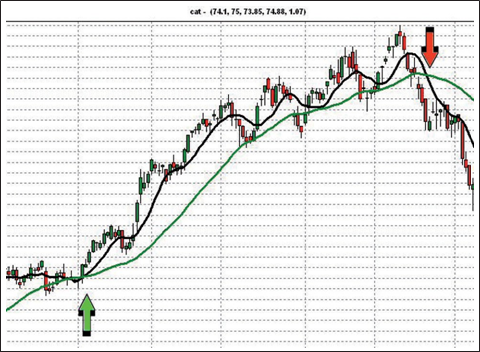
Risk management systems that set stop-loss points but generate them according to the simplest rules can be seen again and again. Frequently, there are systems where the entry logic is based on technical analysis and which then consistently follow up this technical analysis for the exit rules as well. With these systems, the stops are achieved by reversing the entry logic. Such a system is shown in Figure 3. In the figure, the entry point is defined by the intersection of the two moving averages. The position thus opened on rising prices is held long until the two averages cross again at the upper end. Then the position is closed. In some cases, such a system is used as "Stop and Reversal" (SAR) system, which means that the position is turned from long to short after reaching the stop point. Such a system has the advantage that it is constantly in the market, but it also has the disadvantage that the position in sideways markets has to be rotated frequently and can therefore generate considerable losses in this phase.
Figure 3. Reversal of the entry logic.
As an alternative to the same indicator, sometimes a different indicator is used for the stop. It can happen that the entry is triggered by a moving average, but the exit is defined by a relative strength indicator, a parabolic or another indicator. However, all these simple possibilities lack an important component, and that is the correlation to the trading account. In many cases, a percentage of the available equity is used as stop-loss. In classical trading literature, common versions vary between 0.5 percent and 1.5 percent. While such a system certainly makes loss minimization possible, it will make an account with a low hit probability or poor position sizing algorithms tend towards zero. The account will lose in the long run in any case.
The reason for this is easy to understand using an example. Let's assume that our account is capitalized at $30,000 and we use 1 percent of the available capital as a stop loss. With this setting, a position would be stopped if the account is $300 minus. The stop loss would take effect.
Let's continue with the assumption that we are trading a stock that currently has a price of $65 and whose volatility is $3.50 per day. If we trade 100 shares of this stock and the stock subsequently moves against us around its volatility, $3.50, this means that we would have to accept a total loss of $350. However, since we can only accept $300 as the limit in the account, the loss would be too high and the stock would be stopped. For us, this scenario is particularly disadvantageous if the share price would rise again immediately after the position has been closed out. In this case our positions would be stopped, i.e. market participation would no longer be secured and we would have to record a realised loss on the trading account.
This example clearly shows that it makes no sense to use a capital-dependent percentage stop if the volatility of the individual securities is not taken into account and the stop lies within the volatility of the respective security traded.
A significant improvement, however, would result from a simple change. Instead of applying the percentage value to the total account, it is only applied to the invested equity as long as it is either equal to or less than leverage 1. In the equities area, a relatively simple change results in a significant improvement. However, this simple rule does not apply to automatically leveraged products such as futures or CFDs, since the leverage already existing in the position must be taken into account here.
"I've already familiarized myself a little with the platform and I can already tell you that this is the best platform I've worked on so far, my congratulations." - Peter
"The trading platform is simply great. You find your way around immediately. The trading offer is also really great. The support is competent, friendly and fast. The list of positive points is endless, but I’ll leave it at that. They are really great! Please keep up the good work." - Christopher
"The possibilities with sentimentors on the platform are simply endless. It’s brillant." - Manfred
If the correlation to the trading account was missing in our previous example, the correlation to the volatility of the traded security is missing in this example. Here, too, a quick improvement is possible by applying this correlation. For this the trader uses a classic indicator, the ATR (Average True Range), which gives him a rough idea of the volatility of the security. Although sophisticated stop systems can be developed with the help of the ATR, even a very simple application of this indicator is sufficient to significantly improve the performance. The stop is simply set outside the ATR. If the ATR shows $3.50 as in the example above, then the trader sets the stop at $3.70 or, even better, at $4.
This usually maintains the position, as the price of the stock no longer comes close to the stop price, as long as no special market conditions occur.
This method is suitable for simple, fast information, but it does not satisfy professional requirements. For us, another method has therefore proved its worth. Explained using an example from the stock market, it can also be applied to other securities markets.
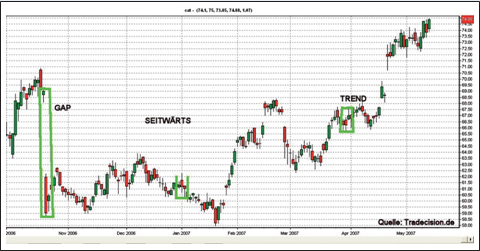
In our method we look at the half-year daily chart of a stock, in this case Caterpillar (CAT). We are interested in the three basic movements in securities trading, the gap, the sideways movement and the trend. Let's first look at the gap in Figure 4. We look at three candles of a movement, here the three candles in the green box. We are interested in the high of the candle before the gap, because it is the highest high of the three candles, and the low of the second candle, the actual gap candle, because this low shows the lowest low of the three candles. We note the difference between high and low, here between $69.30 and $58.80. The difference is $10.50, but since we only want the average, we divide the result by three and get $10.50: 3 = $3.50.
The cut of the gap phase is therefore $3.50. We note this result.
The next area we look at is the lateral movement. From this range we select three randomly selected days. Which days of lateral movement these are is irrelevant as long as they are three consecutive days. To see here in the green box. Analogous to our previous observation, we look again for high and low of these three candles. In this case we find the high in the second candle at $62.30 and the low in the third candle at $60.30. The difference is $2 and we divide the result again by three, here we get $0.66. We also note this result.
As the last phase, we are interested in a trend. In the picture we found and selected a trend on the right side of the chart. The low is in the second candle of the selection at $65.70, the high in the third candle at $67.50, the difference between the two values is $1.80. We divide this value again by three and get $0.6 as a result. We now have the following values:
- Gap = $3,50
- Sideways = $0,66
- Trend = $0,6
Now we add the three average values found and divide the result again by three, since we have considered three market phases, but only want to have the average in each case. The result is $3.50 + $0.66 + $0.6 = $4.86.
Divided by three, that's $4.86: 3 = $1,62.
This means that Caterpillar's historically realistic average over the last six months is about $1.62 across all possible market phases. We now know the realistic average volatility of the stock and can set the stop outside that volatility.
The average value found in this way reflects the actual, historical volatility of the share over the period observed, whereby it tends somewhat to the pessimistic (i.e. safe) side, since the gap phases are also included in the calculation, but in reality, these occur much less frequently than the sideways or trend movements. The value found in this way is much more realistic than the value indicated by the ATR, even if the ATR was observed over a six-month period.
To get values that are even more accurate, we can weigh the individual phases according to their occurrence. These are the approximate frequency percentages.
- 80% lateral phase
- 17% trend
- 3% gap
PROFIT FLUCTUATIONS
In classic trading literature, profit targets are often used. This approach is naturally not very efficient and completely contradicts the principle of "letting profits run". Far too often, such profit targets in an account close exactly those positions that generate the highest and sometimes the only profit in the account.
Figure 4: Three market phases.
It is understandable, however, that a trader encounters this problem at some point and then makes the mistake of closing out positions in profit too quickly because he wants to secure the profit achieved. Many traders encounter the following scenario:
The stop is set and also promises a good profit, but in the course of the trade it is unfortunately also hit, the position is closed out. That alone would not be bad, because the stop closed the position in profit, unfortunately the market begins to move further in the direction initially taken. However, since the trade is already closed, no further profit is gained. Frustration resulting from this stop set "incorrectly" will lead to the trader placing this stop further away in one or more of the following trades in order to stay longer in position.
It is therefore not easy to estimate how far the stop should be placed and to what it can be attached. Which criteria can be used to set a stop correctly? The solution for many traders is to look for a support or resistance zone for their stop and then position the stop near this zone. While this approach is not entirely wrong (in the case of a high open profit in the account, it can be easily applied), it is completely counterproductive for most scenarios. Since the stop is artificially placed near a support or resistance line on the chart, it usually has no correlation to the existing profit or spread of the stock (here it is again, the correlation to the existing account). Although some control is suggested to the trader, this stop is as artificial as any other stop created by gut feeling, emotional reasons or any other strategy not correlated with profit. A stop found through the movement of the account or profit rarely coincides with a stop near a support or resistance zone.
Once again, improvement can be reached by taking the volatility into consideration. As soon as a profit exceeds the simple movement range of the security, the profit protection stop can be set to exactly this target mark, i.e. to: Price - (Vola * 1).
A profit secured in this way has a significantly higher chance of holding longer.
TRANSLATION INTO A TRADING SYSTEM
Now that we have dealt in depth with the theory of risk, the necessary stops and profit protection, we want to develop a trading system that contains all these components. This trading system will be a solid basis for further experiments.
Figure 5 shows us all trades and the stops. It starts with a short trade in August 2006. The stop loss is initially placed at -$162, the short trade is entered at $71. Let it be noted that we do not start from the ideal case, but always open a position a little worse than it would be possible in reality, so it is not about finding the exact value at the upper or lower end of a candle, but about finding a realistic entry.
Figure 5 In practice.
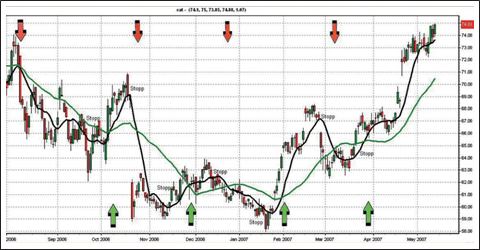
We applied the system to CAT and defined the following criteria. The entry is determined with a simple trend following indicator, in this case, two simple moving averages. The black average line is a simple moving average (SMA) in 9 periods. It is the average of the last nine days.
The green line is a simple moving average in 30 periods. Our entry is triggered when these two lines cross. If the black line crosses the green line upwards, we enter long; if it crosses from downwards, we enter short. We do not take a new position if we are already in position due to our risk and money management, but we do receive a new signal. That is all, we have not defined any further considerations with regard to the entry. So, we are always in the market, even in lateral phases.
In doing so, we followed our first rule set out above and kept our entry simple, while at the same time securing market participation.
Deutsches Kundeninstitut Broker Comparison
„We would like to inform you that WH SelfInvest scored 5 out of 5 stars with the BEST possible evaluation „very good“ (1,3). You are the CFD-Broker of 2019.Congratulations!“

These are the results of WH SelfInvest in the subcategories:
- Trading: 5 out of 5 stars, very good.
- Trading platform: 5 out of 5 stars, very good.
- Mobile trading: 5 out of 5 stars, very good.
- Client service: 5 out of 5 stars, very good.“
Test the free demo for the trading platform NanoTrader Full
Next, we'll work on risk and money management and that’s where it gets more complex. At the beginning of each trade we define the quantity and keep it simple by performing a test with 1 lot, i.e. buying or selling 100 shares at the beginning of each trade.
From there we can define risk management. We know from our example above that the stock has a historical volatility of about $1.62. This means that we have to set the stop in the first trade to this amount. Since we are selling 100 shares, our loss in the first trade can be of $162.
This value is increased as soon as the profit increases by twice the volatility: $324. We also define that if the stock makes a profit of more than 0.5 percent, we will raise the stop to break-even. At $70 that would be $0.35 or with 100 shares in the position a gain of $35.
Now we have to define when we want to move the stop from break-even to profit. The stop is only pulled from break-even in one of two cases.
The stock has made a gain of more than ten percent (which means we are in a longer lasting trend), or
our first trade has made a profit or a profit was made with follow-up trades and this profit is higher than the volatility of the stock, in this case more than $162.
Therefore, we use a trailing stop when one of the two points defined above occurs. In order to keep this rule simple, our stop trails the market by 20 percent. So, if the stock has made a profit of $3, the stop trails at a distance of $0.60 ($3 * 0.2).
To avoid over-complicating our simple example, the increase of the position in case of profit is not considered here. Now that rules have been defined, let’s take a look at Caterpillar's chart and the trades that have been triggered.
TRADING THE SYSTEM
Figure 5 shows us all the trades and stops. It starts with a short trade in August 2006. The stop-loss is initially placed at -$162 and the trade is entered at $71. Please note that our example is not an ideal case, but that we always open a position a little worse than it would be possible in reality, so that it is not about finding the exact value at the top or bottom of a candle, but about finding a realistic entry.
Since this first trade makes a profit relatively quickly, we can pull the stop to break-even and leave it there. According to the rules defined above, this is our first trade and we want to give the stock space for as much movement as possible.
Mid-September, the stock falls below $64 increasing the profit by more than 10 percent, so we now activate the trailing stop, which is triggered at the end of September at $1.28 ($64 * 0.2). The profit realised in this first trade is a little over $600 and, according to our rules, this implies that in the following trades the stop-loss will be set to break-even every time a profit is generated and that we will then activate a trailing stop.
The next trade is long at $68, beginning of October, and reaches a peak at $71. The trade is rapidly secured with a break-even stop and the trailing stop is activated after it has gone into profit. The trailing stop triggers before the large gap and the position is closed out. Since the trade peaked at $3, the stop trails at a distance of $0.60 and the trade is stopped with a profit of $2.40 (or $240 for the total position of 100 shares). But let's assume for all the pessimists that this trade ends at zero, i.e. has made no profit. Then, our total profit from the first trade would still be around $600. The third trade is entered at the end of November at around $61 and is short. This trade runs immediately into profit, makes a gain of $2 at the peak and is thus closed out by our trailing stop, which trails at a distance of $0.40. The profit in this trade is of $160. Added to our existing profit, this gives a total profit of $740 so far. The next trade is short at $61 at the end of December and runs into profit after a short period of loss. This position reaches a maximum profit of about $3, and a trailing stop is activated at a distance of $0.60. The trailing stop is triggered mid-January. The profit is of $240 and our account has already risen to $980. The next trade of the system is a buy entered at the beginning of February at $65. The profit is of $3 to a little over $68 and is closed with the trailing stop with a profit of about $240, bringing total profit to $1220.
A short trade in March brings no profit, but is stopped at break-even leaving the account balance unchanged.
And the last trade is a long trade, which is opened at the end of March and is still open. We don't know the exact outcome of this trade yet, but it has risen by about $8 from $67 to $75 so far, so our trailing stop follows with an interval of $1.60. Our trading system has made a profit of around $1220 so far, but we have been very pessimistic, have not increased the position and have not included the open profit. However, this system has a relatively simple entry logic and only secures the profit with a clever control of risk and money management.
CONCLUSION
The article has shown that the trader's attention should not be focused on the development of an entry system, as a wide variety of systems are already available, but that it makes much more sense to deal with the exits. The time taken to find an entry should be roughly tripled to build a meaningful risk- and money management system. It is much more important to wisely think through the exit logic and adapt it to the account balance. In any case, the trader must establish a correlation between his account and the trades he enters.
Detlef Wormstall.

Free demo

Trading videos
Charting, strategies, automated trading, backtesting, playback... watch these videos and become a platform master.

Broker
WH SelfInvest serves traders from offices in Germany, France, Switzerland, Belgium, Luxemburg and the Netherlands.
The spectacular SignalRadar
SignalRadar shows live trades being executed by various trading strategies.
More ...
- 1 of 5
- next ›