Test NanoTrader Full I Test Tradingview I Test the mobile platforms All for CFD-Forex & Futures
You are here
Scalping trading ranges with the new Sniper
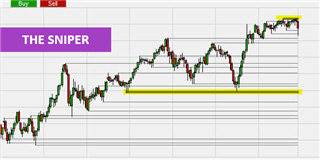
Market prices reflect the balance of power between buyers and sellers. When buyers and sellers are equally strong, prices tend to oscillate around an equilibrium price. The market is said to be moving in a range. Ranges can last for varying lengths of time depending on a number of factors. In any case, they represent excellent trading opportunities for those who know how to spot and exploit them. In this article, we present range trading by showing how to approach it with the SNIPER indicator, the latest innovation from WH SELFINVEST. The Sniper is available in the NanoTrader trading platform.
How to recognize a trading range?
Ranges are easy to recognise. All you have to do is watch the price movement carefully and spot the moments when they oscillate between two price levels as in the example below.
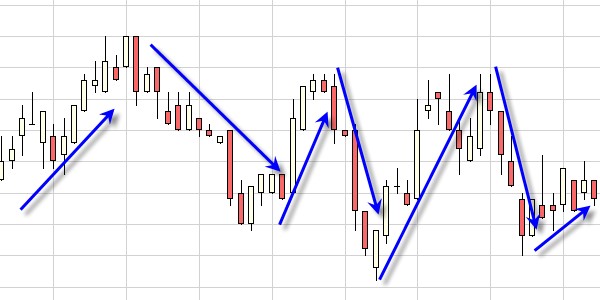
When prices move in a range, they produce a succession of short movements that alternate between rising and falling. These movements have in common that they are stopped at the top by a price level called resistance and at the bottom by a price level called support.
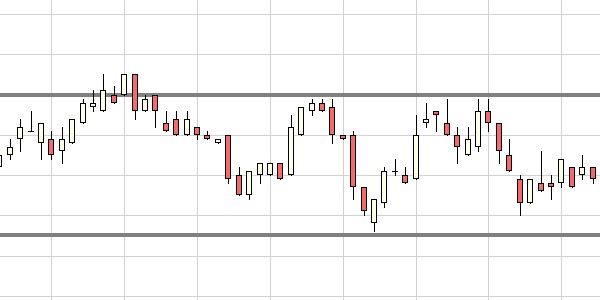
Make trading ranges appear with the Sniper
As can be seen below, the SNIPER indicator has automatically drawn horizontal support and resistance lines in the same chart as the previous one. These lines are based on the price movements that have occurred since the beginning of the chart.
To understand the SNIPER line, we need to take a step back and observe the same market movement over an extended evaluation period. Thus, in the chart below, which includes the previous trading day, the range studied is framed in red. We can see that the previous day, the price had been blocked at the beginning of the day at level 1 corresponding to our range top and level 2 corresponding to our range bottom.
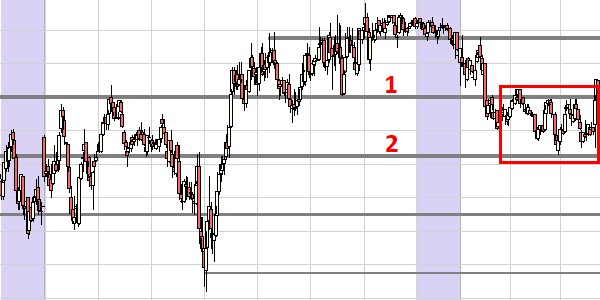
The lines drawn by the SNIPER indicator reflect the price levels at which trend reversals have occurred, either momentary or permanent. For scalpers and day traders, this information is extremely valuable as it can enable them to recognise the beginnings of potential ranges and exploit them to their advantage.
Detect the start of a trading range
Range periods usually follow trend periods and vice versa. In the example below, we can observe a period of upward trend which reached its maximum at point 1. Following this, we can observe a typical chart pattern of a range start.
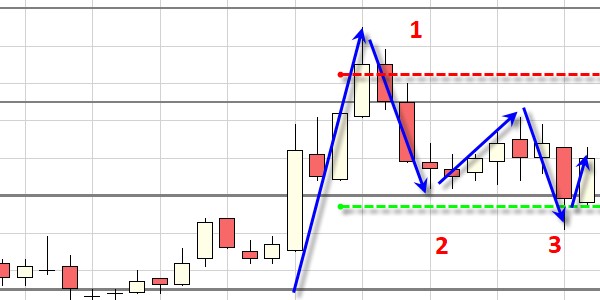
At point 1, the price is pushed down. It retreats to the SNIPER line at point 2, but does not manage to cross it. We can already suspect that the market is entering a range delimited by the dotted lines. This is confirmed a little later as the market is pushed down by the upper SNIPER line before bouncing up at point 3. At this point, we are clearly in a range that we can try to exploit by following the strategy described in the next paragraphs.
When to open a position
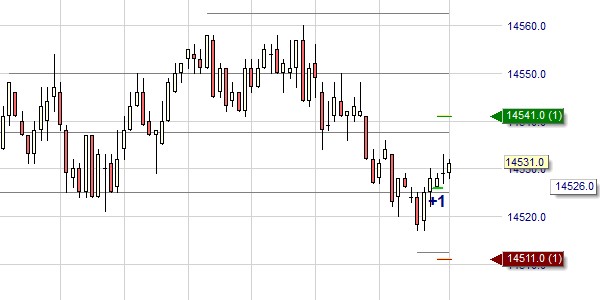
In the example below of the Mini-Dax future in 1mn, the range is defined by the SNIPER lines 14525-14550. When a range has been identified, we try to sell at the top of the range and buy at the bottom. You can use any type of order: limit, stop or market. Personally, I use market orders. In order to be precise and reactive in my orders, I have set up a hotkey as a market order: one click, one position! Below, we enter a long position after the price rebounded on the SNIPER 14525 support.
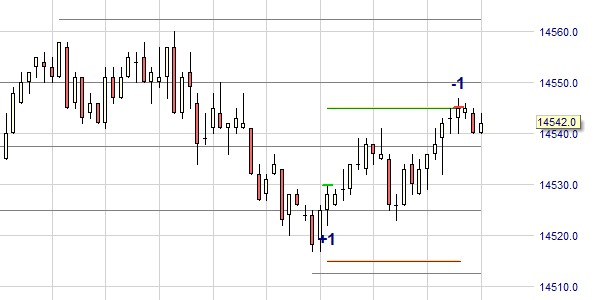
Managing the open position correctly
To work with ranges, we use the TradeGuard+AutoOrder mode, which automatically sets a stop/target pair when a position is opened, and allows these orders to be moved by hand on the chart. The target should be set to be close to the upper edge of the range while remaining within the range. Here, the initial distance of the target is 30 points and it turns out to be perfect.
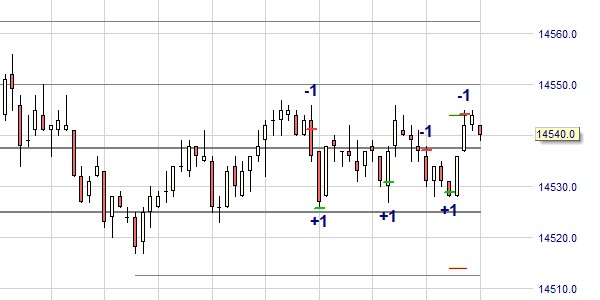
After the first trade, you can continue to trade as long as the range continues. You sell at the top of the range and buy back at the bottom. It's better to have relatively short targets to increase your chances of winning. Below, we followed up with two more winning trades.
Conclusions
Range trading is complementary to trend following trading. It allows to make productive low volatility market phases, which are at first sight less interesting. These phases are in fact frequent. They occur every day and on all types of financial instruments. To identify range phases, the SNIPER indicator is used. It draws support/resistance lines based on recent market developments. Using these lines, scalpers can recognise chart patterns similar to the one described in this article and try to exploit them. As long as the range continues, scalpers are able to exploit small market movements. SNIPER is an indispensable indicator for scalpers who want to win in the markets!
People also read
The Supres Sniper
What strategy to trade the NASDAQ?
Free demo

Trading videos
Charting, strategies, automated trading, backtesting, playback... watch these videos and become a platform master.

Broker
WH SelfInvest serves traders from offices in Germany, France, Switzerland, Belgium, Luxemburg and the Netherlands.
The spectacular SignalRadar
SignalRadar shows live trades being executed by various trading strategies.
More ...
- 1 of 5
- next ›