Test NanoTrader Full I Test Tradingview I Test the mobile platforms All for CFD-Forex & Futures
You are here
The SuperTrend Channel Indicator
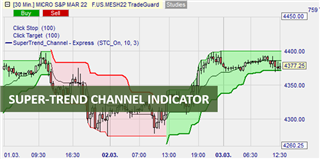
Trend trading is the most commonly used strategy by short and long term traders. The best way to trade the trend is usually to enter when the trend starts to form. Ideally, trends are easy to spot during reversals and breakouts. This is where the SuperTrend Channel indicator comes into play.
Advantages of the SuperTrend Channel indicator:
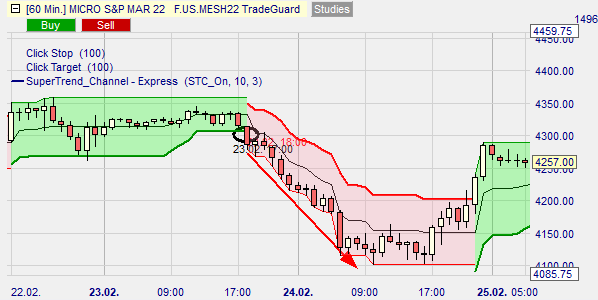
- It is colored green and red to indicate bullish and bearish trends, respectively
- It can be used to generate signals on NanoTrader
- It can be used to filter out trends on any time frame
What is the SuperTrend Channel indicator?
The SuperTrend Channel indicator is a variation of the SuperTrend indicator. This means that we must first understand the SuperTrend indicator.
The Supertrend indicator is a color-coded trend indicator that identifies the potential support and resistance areas depending on the volatility of the asset. Volatility is measured using the Average True Range (ATR). Note that ATR is only used to calculate volatility and not to identify the trend. When calculating the SuperTrend indicator, the ATR is adjusted by a multiplier of 3. That is, the ATR is multiplied by 3 to subtract the bands from the price and increase the accuracy of the indicator.
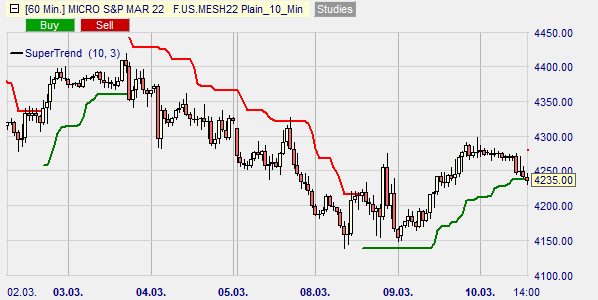
The indicator consists only of a line that changes from one side of the candles to the other. It turns green when an uptrend starts and red when a downtrend starts. The figure below shows the Supertrend indicator.
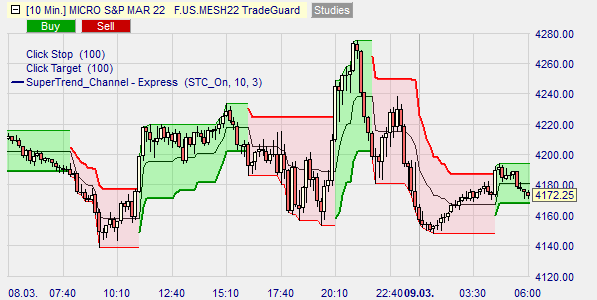
The difference between the SuperTrend Channel indicator and the SuperTrend indicator is that the SuperTrend Channel indicator introduces a second line. This second line is drawn along the highs and lows of the last candles. This line closes the gaps between the upper and lower lines and forms an upward or downward channel depending on the breakout.
How does the SuperTrend Channel indicator work?
The SuperTrend Channel indicator provides support and resistance, which means that buy and sell signals are generated when the price breaks out of the channel. Note that this indicator works best in a trending market. So if you see the asset trading within a horizontal channel, it is best not to use the SuperTrend Channel indicator.
You can also use the SuperTrend Channel indicator to automate trading in NanoTrader.
Buy signals
A buy signal is generated when the price closes above the bearish (red) channel. When it does, the green channel forms, indicating the reversal of the downtrend. We have already mentioned that this indicator works best in a trending market. Therefore, make sure that the black center line is also rising.
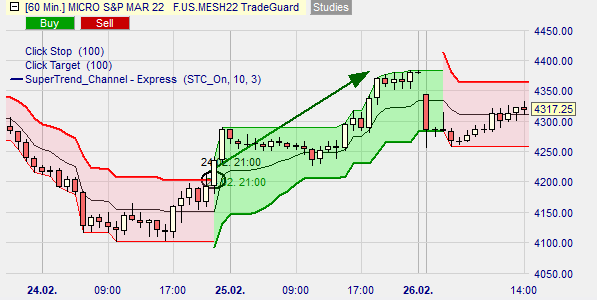
Ideally, set the stop loss at least twice the ATR. Alternatively, you can also abandon the long position when the red channel appears, as this shows that the uptrend is ending.
Sell signals
A sell signal is generated when the price closes below the green channel. In this case, a red channel is formed, indicating that the uptrend is about to make a complete reversal and the downtrend is just beginning. To ensure the correctness of the sell signal, you should pay attention to the fact that the black center line is downward, which means that the asset is in a trending phase.
Close the short position when the green channel appears on the chart. This means that the downtrend is over. Also, set the stop loss at least twice the ATR to avoid getting out early in a volatile market.
Conclusion
The SuperTrend Channel indicator in NanoTrader calculates support and resistance levels based on the volatility of an asset. The indicator uses the Average True Range (ATR) indicator and the highs and lows of the last candles to form the color-coded channels. Ideally, a buy signal is generated when the price breaks above the bearish channel and a sell signal is generated when the price breaks below the bullish channel.
People also read these trading articles
Free demo

Trading videos
Charting, strategies, automated trading, backtesting, playback... watch these videos and become a platform master.

Broker
WH SelfInvest serves traders from offices in Germany, France, Switzerland, Belgium, Luxemburg and the Netherlands.
The spectacular SignalRadar
SignalRadar shows live trades being executed by various trading strategies.
More ...
- 1 of 5
- next ›