Test NanoTrader Full I Test Tradingview I Test the mobile platforms All for CFD-Forex & Futures
You are here
Trading the DAX with J. Welles Wilder's Parabolic SAR
The Parabolic SAR indicator was developed by J. Welles Wilder. It is an extremely versatile indicator, which can be used as a trading signal, a stop or a trend filter. This makes it a valuable, even indispensable tool for trading strategy developers. In this article, we will see how to use it as a signal and trend filter in order to develop a day trading strategy on the Dax.
These are the advantages of the Parabolic SAR indicator:
- can be used as a trading signal, and
- can be used as a trend filter, and
- can be used as a stop
- very nice visually
- designed by J. Welles Wilder
1. PARABOLIC SAR AS A SIGNAL
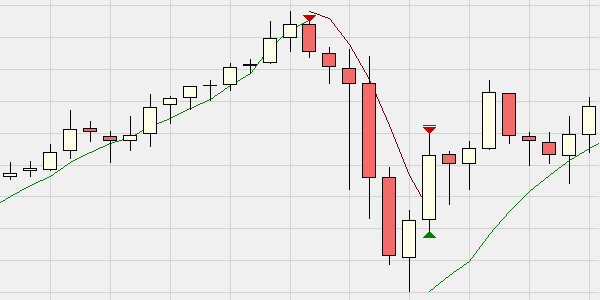
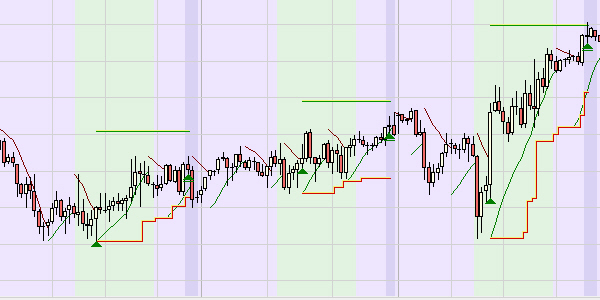
The Parabolic SAR indicator is represented by two curves: one green and one red. As can be seen in the example below, the green curves accompany bullish trends while the red curve accompanies a bearish trend. When the market is bullish and a candle closes below the green curve, a sell signal is triggered (see the first red triangle). When the market is bearish and a candle closes above the red curve, a bullish signal is triggered (see the green triangle).
This example demonstrates the value of using Parabolic SAR as a signal. It seems to be very effective for entering positions following trend reversals.
2. THE PARABOLIC SAR AS A TREND FILTER
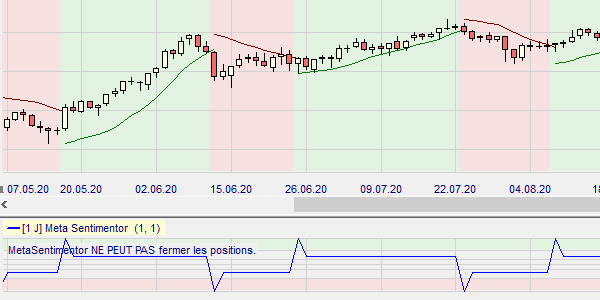
One of the principles of common sense in trading is to trade in the direction of the trend. However, as we saw in the previous example, the Parabolic SAR curves make it possible to identify the trend at any time. To build a trend filter, we load the Parabolic SAR (1; 5; 0.02; 0; 2) into a daily chart.
The best trading platform? Try the free NanoTrader demo
In the upper part, the candlestick chart shows the daily evolution of the Dax. The green and red curves of the Parabolic SAR define bullish or bearish trends. In the lower part, the Meta Sentimentor curve represents the sentiment of the Parabolic SAR. When the trend is bullish, the sentiment is 65. When the trend is bearish, the sentiment is 35. This information will prove very valuable when building the strategy.
3. BUILDING A PARABOLIC SAR STRATEGY
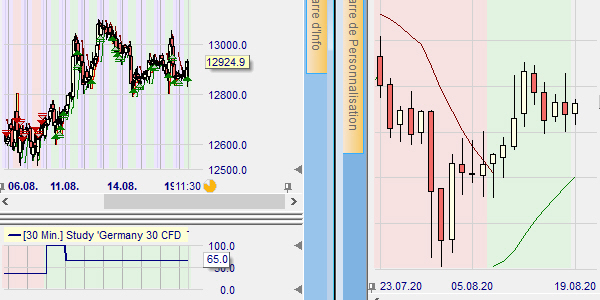
To build a strategy with the Parabolic SAR, we create two studies. Study 1 generates the signals. It is composed of a 30mn chart containing the Parabolic SAR (1; 10; 0.05; 0.5), a Flat filter at 22h00, Block filters to limit the trading period to 9h00 - 18h00, the default stop PeriodsHighLow and a fixed target at 3 ATR (20). Study 2 determines the trend. It corresponds to the previous example.
Once the two studies are created, simply import Study 2 into Study 1. This has two consequences. First, the background of the chart in Study 1 will turn green if the trend is bullish and red if the trend is bearish. Second, Study 1 will only display and execute signals that are oriented in the direction of the trend defined by Study 2. Below, on the right is the daily chart of Study 2 which shows the Dax in an uptrend, and on the left is the 30mn chart with a green background in line with the recent uptrend.
The best trading platform? Try the free NanoTrader demo
The result is a strategy that can be saved and applied as a model to other instruments. All its parameters can be modified or optimized in a back-test to achieve greater profit. The strategy can also be automated by activating the AutoOrder mode. Below is a succession of three winning trades.
The best trading platform? Try the free NanoTrader demo
4. RESULT OF THE BACK-TEST
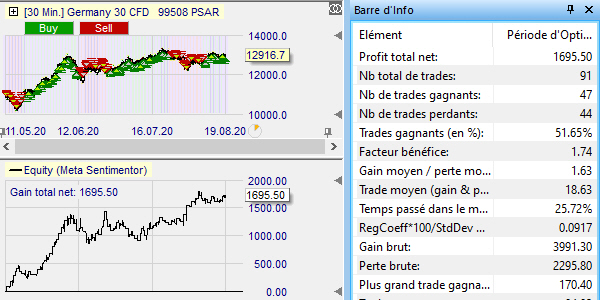
A back-test shows the profit that would have been made if the strategy had been applied over a given period of time in the past. Beware, a profitable back-test does not necessarily mean that the strategy will continue to perform in the future. However, it remains an important indication of the strategy's ability to perform in the future. As can be seen below, with the profit curve and the statistics, our strategy would have given interesting results.
The best trading platform? Try the free NanoTrader demo
5. CONCLUSION
The Parabolic SAR is a really worthy indicator for developers of trading strategies. As we have seen in this article, its multi-functionality allows it to be used effectively as a signal as well as a trend filter. This makes it a potential solution to many of the problems facing traders. Clearly, Parabolic SAR is an indicator that deserves to be known and used by active traders.
The opinion of a professional trader...

Visit the website of the legendary broker WH SelfInvest

Free demo

Trading videos
Charting, strategies, automated trading, backtesting, playback... watch these videos and become a platform master.

Broker
WH SelfInvest serves traders from offices in Germany, France, Switzerland, Belgium, Luxemburg and the Netherlands.
The spectacular SignalRadar
SignalRadar shows live trades being executed by various trading strategies.
More ...
- 1 of 5
- next ›