Test NanoTrader Full I Test Tradingview I Test the mobile platforms All for CFD-Forex & Futures
You are here
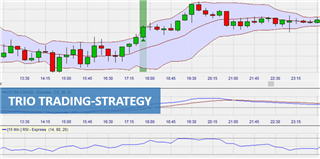
The Trio Trading-Strategy
Most technical indicators are accused of being too slow or too inaccurate to provide accurate trading signals. This means that traders have to clutter their charts with multiple indicators, which are often confusing and confusing, leading to missed opportunities and avoidable losses. This is where the trio strategy comes in.
Advantages of the Trio Trading-Strategy:
- It generates signals using common momentum and trend indicators
- Entry signals for long and short trades are highlighted in NanoTrader
- Easy to determine when to end a trade
What is the Trio Trading-Strategy?
The Trio strategy combines three technical analysis indicators that work in unison to provide the best entry and exit signals. The three technical indicators included in this strategy are the Bollinger Bands, MACD and RSI. These indicators are undoubtedly some of the most popular and easiest to use technical indicators in trading. However, when used individually, they can be prone to many fakeouts, but together they provide optimal entry and exit points based on the momentum and trend of the asset.
How does the Trio strategy work?
The Bollinger bands are both a momentum and a trend indicator. When the upper band rises, it indicates an uptrend, and when the lower band falls, the asset is in a downtrend. Price momentum is determined by whether the price breaks out above or below the Bollinger Bands. There is upward momentum when the price breaks above the upper band and downward momentum when it breaks below the lower band.
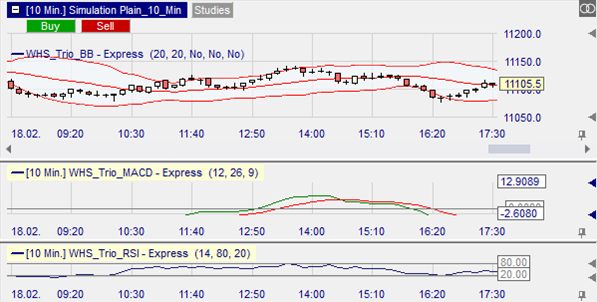
The RSI is a momentum indicator. The indicator consists of a line that fluctuates between 0 and 100. When the RSI reaches a value of 70, the market is usually considered overbought and loses its bullish momentum. On the other hand, when it reaches 30, it is considered oversold and loses its bearish momentum. When the RSI is above 50, it indicates increasing upward momentum, while a drop below 50 indicates increasing downward momentum.
The MACD is a trend following momentum indicator. The main components of the MACD indicator are the MACD line and the signal line, which are based on the exponential moving averages (EMAs). Normally, upward momentum occurs when the MACD line crosses above the signal line, while downward momentum occurs when the MACD crosses below the signal line.
How to trade with the Trio strategy
Trading with the Trio strategy is determined by the signals generated by the three indicators. Note that the indicators must match for the signal to be generated.
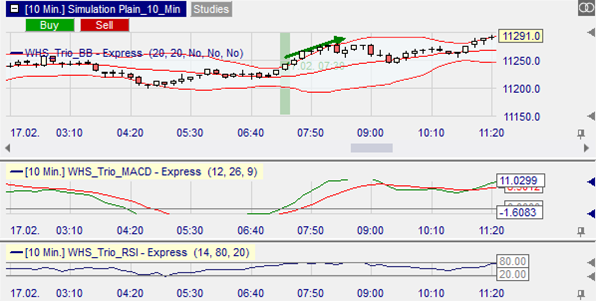
Buy signal
The Trio strategy generates a buy signal when the three indicators show an uptrend and momentum. The bullish entry in NanoTrader is highlighted by a green background. The signal is generated under the following conditions:
- The upper band of the Bollinger Band indicator must rise
- The asset price breaks out above the upper band
- The RSI crosses above 50
- The MACD line crosses above the signal line
You can close the long position when the Bollinger bands start to fall.
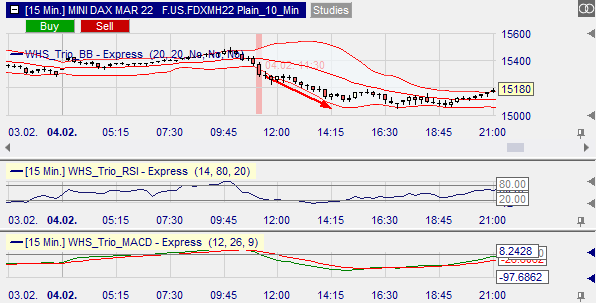
Sell signal
The signal to sell the market is generated when the three technical indicators show a downtrend and momentum. The bearish entry is highlighted with a red background in NanoTrader. The signal is generated under the following conditions:
- The lower band of the Bollinger Bands is falling
- The price breaks below the lower band
- The RSI falls below 50
- The MACD line falls below the signal line
The short position is closed when the Bollinger bands start to reverse.
Conclusion
The Trio strategy simplifies the concept of trend and momentum trading by combining the three most effective technical indicators. The combination of the Bollinger Bands, the MACD and the RSI indicator is the simplest and most effective way of trading. It improves entry and exit signals while eliminating possible false signals, when these indicators are used individually.
People also read these trading articles
Free demo

Trading videos
Charting, strategies, automated trading, backtesting, playback... watch these videos and become a platform master.

Broker
WH SelfInvest serves traders from offices in Germany, France, Switzerland, Belgium, Luxemburg and the Netherlands.
The spectacular SignalRadar
SignalRadar shows live trades being executed by various trading strategies.
More ...
- 1 of 5
- next ›