Test NanoTrader Full I Test Tradingview I Test the mobile platforms All for CFD-Forex & Futures
You are here
The volume profile: the hidden dimension of markets

What if there was a robust and effective way to trade on the markets? Most traders use indicators and chart patterns when trading, but recently more and more professional traders have favoured a powerful method known as the auction market theory. If you use a "covert" dimension of markets known to relatively few market participants, you can gain a real competitive advantage.
THE HIDDEN DIMENSION
When you hear the word "volume", you probably think about how much volume or revenue was generated in a certain period of time, for example: How many contracts were traded in a 5-minute bar? But there is another view of volume that can be much more useful from a trading perspective.
This refers to the horizontal dimension, better known as "volume at price". Rather than seeing volume in relation to time, this dimension shows us how much volume was transacted during the day at a given price. Figure 1 shows an example of an E-mini S&P 500 chart showing the horizontal volume. Each horizontal bar is placed above a specific price and each time the market quotes at that price throughout the day, more volume appears on the horizontal bar. As you can see, 1371.75 and 1372 points were the prices at which most of the volume was traded on that particular day.
Figure 1. Volume Profile E-mini S&P 500. This chart shows a Volume Profile, displayed on a price chart of the E-mini S&P 500. The strongest part of the volume distribution is known as the Value Range and appears here as the area between the two red lines. The price with the highest volume is called the high volume node, which is 1371.75-1372 here.
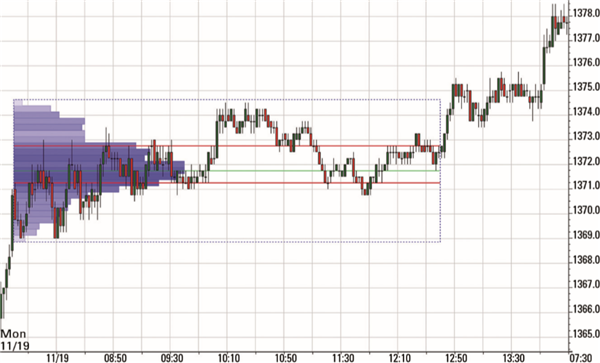

The horizontal volume bars together look like a bell-shaped curve. The middle (dark blue) part of the volume distribution is known as the value area. In the auction market theory on which this methodology is based, the market is analysed through the "lens" of the value range. The longer the market stays within a certain price range, the more volume is exchanged there. And the more volume is exchanged, the more this indicates that this range represents the fair value for buyers and sellers. If, on the other hand, the market only stays in one area for a short time only and does not come back to it during that day, not much horizontal volume will build up there. This means that either the sellers thought the price was overvalued or the buyers thought the price was undervalued, which is why they quickly discarded it. The horizontal volume dimension shown on a price chart rapidly indicates where market participants think the real value is, but also where one side quickly rejected the prices.
HOW TO PROFIT FROM VALUE AREAS
While there are many ways to use the meaningful information found on the horizontal volume scale, only the most effective method will be discussed here.
This method uses the value ranges (i.e. the price ranges with high horizontal volumes) as "hidden" but highly accurate support/resistance lines where you can enter. Behind this is the following consideration: When the market is busy balancing itself - that is, moving sideways or developing a trading range - a value range in a narrow range of prices emerges. If the price finally moves away from this value range, many market participants are caught on the wrong foot. For example, if the price breaks upwards, many short positions will fall into the trap. Traders who trade in the shortest time frame, like scalpers and day traders, will exit their loss positions immediately, but many others, such as swing traders, will still remain in their position. If the price later lands back in this value range, those short positions that were trapped will try to buy back their position at break even. This buying activity turns that area into a large support zone. This zone is often stronger than other support zones because it has so many participants who are active there as that is where high volumes were previously exchanged. This is what makes up a value area in the first place.
Experiences with the Broker WH SelfInvest:
„Yesterday’s webinar was very good.” – Matt
„For me and some of my neighbours, this is the best talk we've ever heard on trading systems, indicators, etc.” – Will
„The topics were very interesting, all lecturers very competent and I learnt a lot.” – Ewald
„My compliments, it was a great presentation! First class didactics!” – M.U.

Of course, this concept is by no means new. But what makes this method more efficient than many others, is the fact that relatively few traders still know about the horizontal volume or actually use it. When they look at their charts, they see nothing but the typical support and resistance areas that all traders use and which are therefore often ineffective. But they don't see the horizontal volume.
You can use previous value ranges both as support and as resistance; they work in any time frame and in any market. However, it is important to have an overall view of the market from the larger time frames in order to avoid misusing this type of setup.
THE SETUP
Most traders have learned to trade using indicators and patterns. But the problem is that they spend their time looking for setups that are too simple without being aware of the context of those setups. To stand out from the crowd, you need to learn how to see the market in its context. Then you would no longer need indicators for your trading. This setup uses the market environment as part of its very essence, as it should be with any good setup. What you should look for is this:
1) Clear trend direction in the form of a pronounced price development in one direction.
2) a sideways phase during which the market creates a value range.
3) a breakout from the value range in the direction of the previous price movement.
4) a test of the previous value range.
In the case of an upward movement, the previous value range acts as a great support for the retest. That is the long setup. In the case of a downward movement, the previous value range acts as a large resistance in the retest. This is the short setup.
THE LONG-TERM PERSPECTIVE
In the first step of the setup, you should look at longer time frames to see if the market is moving in a particular direction. Day traders trading on 1 to 5-minute charts should look at 15 or 30-minute charts, or even longer ones, to get a multi-day view of the overall market situation.
Of course, there are no exact numbers and rules, because this is not an automated strategy; it is discretionary trading based on constantly changing market information that must always be correlated.
Professional discretionary traders trade according to robust principles and apply them dynamically, rather than using rigid rules that set precise timeframes and numerical values. It doesn't matter whether you are looking at a 15-minute chart or a 23-minute chart, the same information will appear at the end. What matters is that they look at the charts that give them the best overall view, because it will sometimes changes.
Step 2: Your charting platform should be able to automatically draw the horizontal volume bars. This function is called market profile* (or volume profile) charting technique.
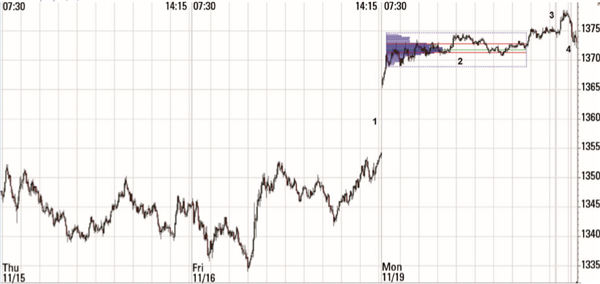
Figure 2 shows a setup for a long trade. The market rallies strongly due to a large gap that leads to a breakout from a two-day sideways range on November 19, 2012. The market thus creates a value range above which the price breaks out in the afternoon. Shortly after, the setup is completed when the previous value range is retested.
Figure 2. Figure 1 in context. Here you can see a long setup. Point 1 in the chart shows a very convincing upward movement, which begins after a large gap with a two-day trading range. The market balances out at point 2 and creates a value range with a strong horizontal volume. A breakout above the value range occurs at point 3 and the previous value range is tested at point 4. The long setup is confirmed by the support.

THE ENTRY
Most trading textbooks tell you to wait for a price confirmation before you start. However, professional traders have a very different way of dealing with entries. The basic principle you need to understand when entering a support/resistance zone is that you enter without waiting for a price confirmation. This usually means that you enter with a long trade when the market appears bearish and with a short trade when the market appears bullish. So you trade differently than the broad masses. It's not easy, but it can give you an advantage.
This type of entry is based on two main concepts, the entry point of the trade and probability. By not waiting for a price jump before entering a long trade (or a price drop before a short trade), you get the optimal trading entry; you take the least possible risk and have the best possible chance at the same time. To trade like this, you need to think in long-term probabilities. People who tell you to wait for price confirmation say you should make sure a zone is stable before entering. In reality, however, if the environment for a trade is favourable and the market-based zone is logical, your chances of winning are good and you should simply execute the trade - knowing that after doing many similar trades you will be a long-term winner. Waiting for confirmation does not increase accuracy, as many assume. The market often moves back and forth along a support or resistance zone and any initial reaction interpreted as confirmation is often nothing more than a back and forth movement. If you are waiting for it, you enter at a worse price and then have to place your stop further, which worsens your risk/reward ratio (RRR).
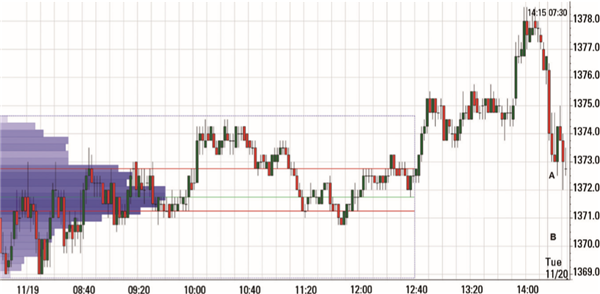
So, the rule for the entry is to get in somewhere in that zone. Figure 3 (A) shows that the entry zone is somewhere between 1371.25 (lower red line) and 1372.75 points (upper red line). This is the high- volume node that represents the previous value range. You can place a limit order at any point between 1371.5 and 1373 - one tick above the zone - or enter optimally when the price reaches the zone.
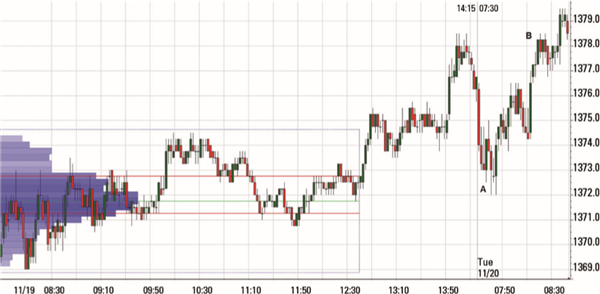
Figure 3: Entry zone and stop. The entry zone is represented by point A and extends from 1373 down to 1371.5 points. Point B shows where the stop would be set. If the price reaches 1370.25 or less, our support zone is clearly broken and the trade would be stopped out.
THE STOP
Setting the stop is simple in such a setup. You place the stop only a little below (long trade) or above (short trade) the zone, because if the price breaks through the zone, it would render it ineffective. If we set the stop in our example at 1370.25 points, you place it one point beyond the zone and "in safety", as shown in Figure 3 (B). Depending on where you enter the trade, you would get a stop size somewhere between 1.25 and 2.75 points.
POSITION SIZE
A very good method for choosing your position size is to use the percentage risk model. For example, if you have a $50,000 account, you can choose to risk two percent of your account on this trade, which puts your risk at $1,000. If you were to enter at 1372.25 points, you would have a stop of two points. At $50 per point in the E-mini S&P, that would be a risk of $100 per contract. To get a risk of $1000 in this trade, you would trade ten contracts ($1000 / $100 per contract).
Experiences with the broker WH SelfInvest:
"I've already familiarized myself a little with the platform and I can already tell you that this is the best platform I've worked on so far, my congratulations." - Peter
"The trading platform is simply great. You find your way around immediately. The trading offer is also really great. The support is competent, friendly and fast. The list of positive points is endless, but I’ll leave it at that. They are really great! Please keep up the good work." - Christopher
"The possibilities with sentimentors on the platform are simply endless. It’s brillant." - Manfred

THE PROFIT EXIT
The profit exit is probably the most complex part of a trade setup. Many traders try to simplify it by escalating to fixed value points. But this affects the overall advantage of a strategy. Most trading coaches teach you precisely that, because it feels emotionally good when your cash registers ring with the "locking in” of profits. However, your goal should be optimal profits and not emotional well-being.
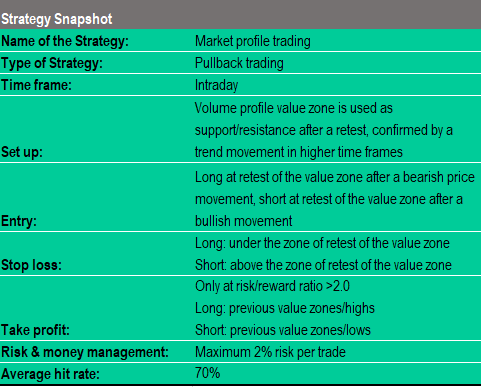
In our example with the E-mini S&P 500, the environment is clearly bullish and we are testing a previous value range that should serve as a great support. The correct exit would not be to scale out of the position, but instead to hold it at least to the next resistance level, which in this case would be the previous day's high at 1378.5 points (Figure 4). This gives a RRR of at least 2:1 for a trade that works in at least 70 percent of the cases. And that's a pretty big advantage.
Figure 4: Profit target. Assuming we entered right at the top of the zone at 1372.75 points (A), we should see to it that we exit at B, the next resistance zone. Although the environment is bullish and this resistance zone is likely to be broken, there was a very large bullish move the previous day. After such a day a consolidation is most likely to follow. So, one would be well advised to take profits at the resistance.

CONCLUSION
The strategy presented in this article uses the auction market theory and the hidden dimension of volume at price. The reason why it is so robust and effective is that it is based on the principles of market behavior and takes advantage of the way markets actually work. With such a solid methodology, you don't need indicators or patterns to find excellent trades.
However, any methodology would be incomplete without proper execution. Therefore, when using the setup presented here, correct entry and exit is crucial. Forget the well-known trading wisdom of always waiting for a price confirmation and scaling out of your position. It is based only on the fact that the majority acts in this way, but the majority also loses. Instead, you should learn how to trade like the professionals who actually earn their living in the markets. This article has tried to show how this works.
Ziad Masri.

Ziad Masri is a professional futures trader. Source : Traders' Mag.
Free demo

Trading videos
Charting, strategies, automated trading, backtesting, playback... watch these videos and become a platform master.

Broker
WH SelfInvest serves traders from offices in Germany, France, Switzerland, Belgium, Luxemburg and the Netherlands.
The spectacular SignalRadar
SignalRadar shows live trades being executed by various trading strategies.
More ...
- 1 of 5
- next ›