Test NanoTrader Full I Test Tradingview I Test the mobile platforms All for CFD-Forex & Futures
You are here
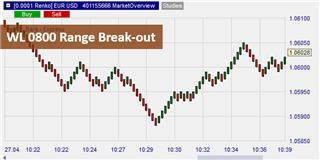
WL 0800 Range Break-out
It goes without saying that the type of chart a trader uses plays a pretty important role in capturing trends - be it a reversal or the end of a trend. Ideally, the chart should clearly define whether a market is trending or moving sideways, and this is where the WL bars come into play.
Advantages of the WL 0800 Range Break-out:
- It is easier to visualize the price of an asset
- Dead zones are avoided and divergences are easy to detect
- Easier definition of entry and exit points
- Easier control of the risk-reward ratio, since all candles have the same size
- It simplifies money management, because all bars have the same size
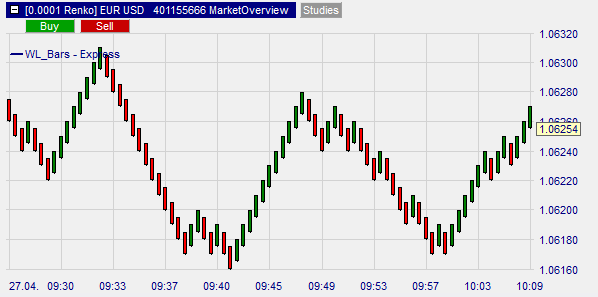
What are the WL bars
The WL bar is a chart based on price movements and not on time. Here a candle is formed on the chart, not based on time, but only when the price of the asset rises or falls by a certain number of pips, ticks or points.
This means that all candles have the same size. The WL Bars were developed based on the philosophy that traders should not care about time, as only the movement and range of an asset are relevant. This is in contrast to other chart types that show price movements in time lapse. Note that the bars open within the body of the previous bar.
According to Wim Lievens, creator of the WL bars, the most common charts used in trading show errors; they tend to favor one aspect over another. For example, Renko charts offer the clarity of a trend, but what is gained in clarity is lost in precision. In contrast, range bars have high precision in showing market movement - they show every tick, but do not have the clarity of Renko bars. Heikin-Ashi simplifies the identification of the trend and trend reversal. However, the disadvantage is that not every candle has the same size - some can be too long, which makes it difficult to identify exit points.
The WL bars combine the detail of the range bars, the clarity of the Renko chart, and the directional simplicity of the Heikin Ashi chart.
How to trade with the WL bars?
Identifying entry points with the WL Bars is as simple as observing trend reversals. Ideally, trend reversal is identified with the WL Bars using the "triads" that mark the high and low points of the market structure. The formation of a triad usually indicates that a trend is losing its upward or downward momentum.
How do I recognize a bullish reversal?
In a downtrend, the triad forms when three candles appear - two bear candles (red) and one bull candle (green). This indicates a decreasing downtrend. As a rule, the entry into a buy price is made above the first bearish candle of the triad.
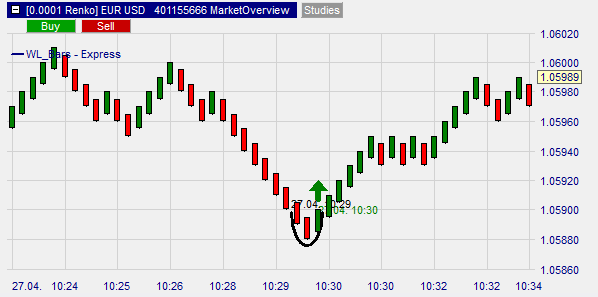
However, if the price does not go beyond this point, it means that the buyers tried to reverse the downtrend, but failed. In this case, it may be a signal for a continuation of the downtrend.
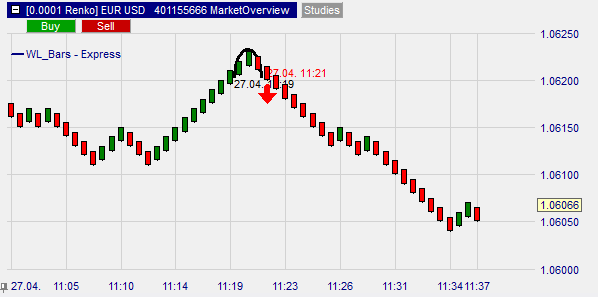
How do I recognize a bearish reversal?
In an uptrend, the triad is formed when three candles appear - two bullish (green) and one bearish (red). In this case, the entry point for a long trade is just below the first green candle of the triad.
Conclusion
WL Bars are basically a combination of the best features of Renko Bars, Range Bars and Heikin-Ashi. The chart is based on price movement and is better than trading with timed charts. Also, identifying exit points is easier with WL Bars. They offer a simple solution to the risk-reward ratio, as all candles are based solely on the price movement.
People also read these trading articles
Free demo

Trading videos
Charting, strategies, automated trading, backtesting, playback... watch these videos and become a platform master.

Broker
WH SelfInvest serves traders from offices in Germany, France, Switzerland, Belgium, Luxemburg and the Netherlands.
The spectacular SignalRadar
SignalRadar shows live trades being executed by various trading strategies.
More ...
- 1 of 5
- next ›