Test NanoTrader Full I Test Tradingview I Test the mobile platforms All for CFD-Forex & Futures
You are here
Sensational Volume Viewer for futures

The Volume Viewer makes futures charts exciting. All executed order volume information is shown in real-time in the charts. The speed of market movements, the quantities traded, big orders... every scrap of information is visible. The Volume Viewer is an outstanding tool for volume-based trading and for scalping strategies.
Advantages of the Volume Viewer
- Shows order volume and execution as a real-time animation in the chart.
- Provides actionable information for scalping and day trading.
- Is 100% FREE in the NanoTrader platform.
- Can be used on all fuutures
The Volume Viewer settings
The main parameters of the Volume Viewer can be set directly in the chart. Click on the number and change the value.
Covered seconds. This parameter determines the length of the animation visible in the chart. A value of 30 seconds means that all executed order volume of the last 30 seconds is continuously visible in the chart.
Condense milliseconds. There are huge amounts of small trades, 1 or 2 lots per trade. By condensing this trading volume into bigger numbers it is easier to interpret market behaviour. A value of 5 or 10 milliseconds is usually good for liquid futures.
Highlight volume above. This parameter colours a box orange if a certain volume of lots are traded. By highlighting big volume in a very short space of time the trader can see the market momentum.
Volume to alternate background after. By setting this value to, for example, 500 the colour of the boxes will change from white to purple and back to white whenever a volume of 500 lots has been traded. It is an indication of the action in the market. The quicker the colour changes, the more volume is traded.
Quick impression video
This silent 45-second video gives you a quick impression of the Volume Viewer.
The Volume Viewer in action
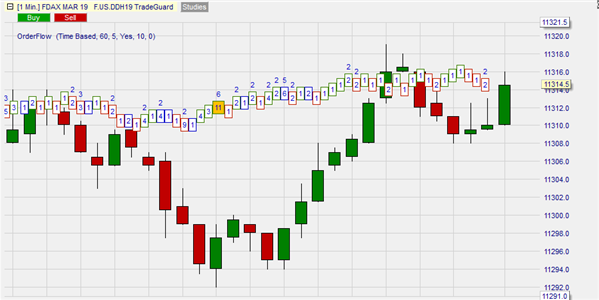
This example shows the DAX future in a 1-minute time frame. The Volume Viewer is set to 60 seconds meaning the Volume Viewer shows all order volume traded in the last minute. The oldest -left- part of the animation shows the order volume which created the initial rise in the market price of the current 'live' green candle. This price rise could not be maintained. It is therefore the shadow of the current green candle. But the price dropped and order volume dried up as indicated by the empty spaces between the boxes. The market is now hesitating.

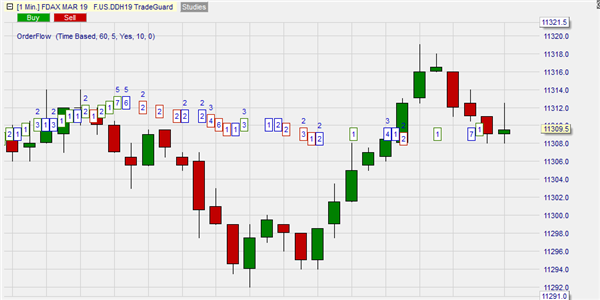
This example shows the same 1-minute chart of the DAX future but 1 ½ minute later. Order volume significantly increased. There are no empty gaps between the boxes. Buyers are buying at the ask price to get in position.

A Volume Viewer-based scalping strategy
The strategy identifies moments when a very large volume of futures contracts is traded in less than a second and at higher (lower) prices. Simply put, a succession of two or three orange blocks at higher (lower) prices. When this occurs the trader buys (sells short) at the market price. If the TradeGuard+AutoOrder is activated, the NanoTrader platform will place a target order at short distance. For example 3 ticks (37,50$) for the S&P 500 future. The trader assumes that momentum will carry the market to his small price target.
This short video shows a trade on the S&P 500 future:
People also read
VWAP and TWAP, a basis for trading strategies
The sensational Volume Viewer for futures
We recommend this regulated managed account service...


