Test NanoTrader Full I Test Tradingview I Test the mobile platforms All for CFD-Forex & Futures
You are here
Day trading using moving averages (part 4)
This article introduces and explores the idea of an adaptive moving average as suggested by trader Perry J. Kaufmann. Most traders look for markets which are showing a trend. This raises the big question “when does a trend start and when does a trend end”. The answer to this question is not an easy one. Being able to identify when a market is in a trend or not can be considered a key success factor. Trading strategies based on technical indicators are more often than not trend-dependant. They tend to work well in trending markets. Such phases can significantly impact the overall result of a trading strategy.
Download a free real-time demo of the NanoTrader Full trading platform
ADAPTIVE MOVING AVERAGES
The answer to the problem is to develop technical indicators which adapt themselves to market conditions. Trader Perry J. Kaufmann launched the idea of an adaptive moving average. His goal was to reduce the ‘noise’ typical for market phases devoid of a trend. Clearing the noise would reduce the number of false signals and thus optimise the performance of the strategy. Let’s take a look at what Kaufmann’s adaptive moving average looks like:
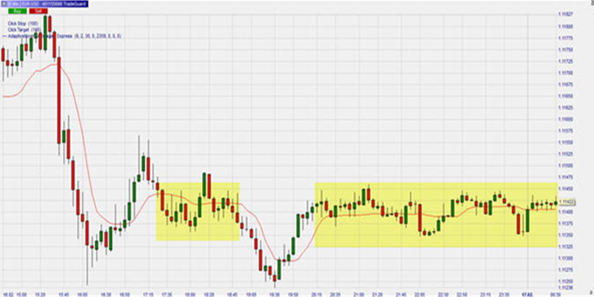
EUR/USD, 5-minute chart
In this example the strong point of the adaptive moving average (AMA) is immediately noticeable. The yellow areas in the chart are phases without any significant trend. The AMA is flat. The small ups and downs in the market are being ignored. As long as the AMA indicator runs more or less horizontally, there is no trend. A rising AMA indicates an upwards trend. A falling AMA indicates a downwards trend. Both trends are being correctly interpreted by the AMA.
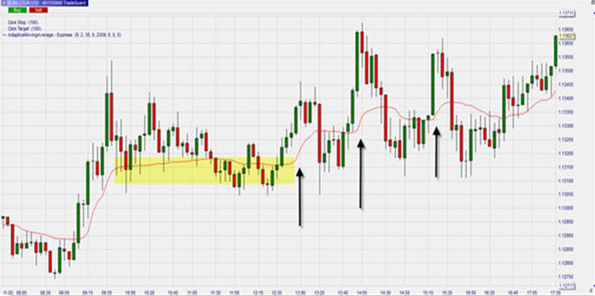
EUR/USD, 5-minute chart
This example is, intentionally, a ‘difficult case’ intended to show the limitations of the adaptive moving average. The morning hours (yellow zone) are being filtered out as having no significant trend. Around noon the first of three rises in the AMA occurs. Because the entries are ‘late’, the signals end up as losing trades.
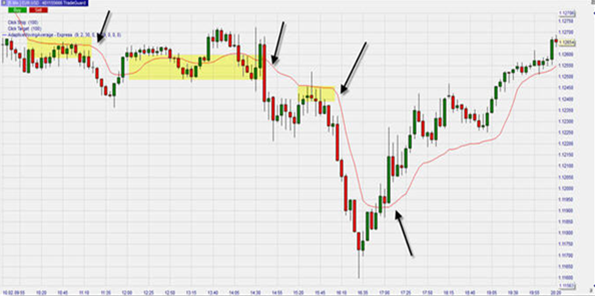
EUR/USD, 5-minute chart
This example shows another uneventful morning in the EUR/USD market. Two short sell signals result in small profits. The third short sell signal, however, captures about 50 pips. The final signal is a buy signal. This is also a profitable signal. All trend-less phases are being identified correctly.
CONCLUSION
The adaptive moving average indicator appears to be a very useful tool for detecting phases with no pronounced market trend. This quality alone is very valuable, because it can protect the trader from streaks of losing trades due to false signals. The trading signals themselves come rather late, which can be a handicap especially on the shorter trends. That is why, for the pure signal generating part of a strategy, an additional element such as a moving average crossover (see part 2 in this series) needs to be added to the mix.
Download a free real-time demo of the NanoTrader Full trading platform
Free demo

Trading videos
Charting, strategies, automated trading, backtesting, playback... watch these videos and become a platform master.

Broker
WH SelfInvest serves traders from offices in Germany, France, Switzerland, Belgium, Luxemburg and the Netherlands.
The spectacular SignalRadar
SignalRadar shows live trades being executed by various trading strategies.
More ...
- ‹ previous
- 2 of 5
- next ›