Test NanoTrader Full I Test Tradingview I Test the mobile platforms All for CFD-Forex & Futures
You are here
How to trade the volatility of crude oil

Crude oil has seen an extremely chaotic period during which the price of the May 2020 Future US Crude Oil contract even closed negative at -$37! Currently, the price of oil is definitely rebounding in the futures markets. It is therefore neccessary to ask what strategy might be appropriate to exploit the current oil dynamics?
The average daily volatility over 5 days on the June 2020 Future contract is around 8%, which is huge and historically high. So there must be plenty of opportunities to capture movement. To meet this challenge, I immediately think of two tools that are particularly well suited to the current context: the Three Line Break signal and the Longlife stop.
THE THREE LINE BREAK TRADING SIGNAL
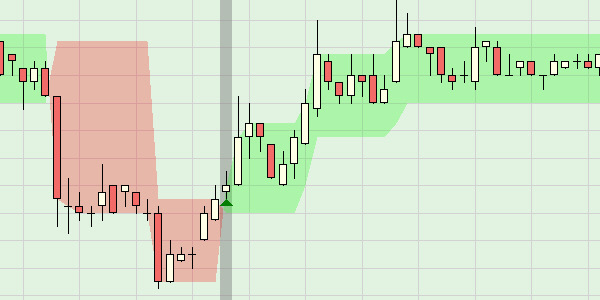
The Three Line Break signal is a trend reversal signal that is derived from the Three Line Break chart. In the NanoTrader platform, this signal is represented by a green band when the market is bullish and red when the market is bearish. This is a particularly effective signal as can be seen in the following example:

Initially, as the market was bearish, a red band wrapped around the price. When the price closes above the upper edge of the red band, a buy signal is triggered and a bullish phase begins. The background of the candle corresponding to the signal is colored gray to make it easier to spot the signals.
THE LONGLIFE STOP
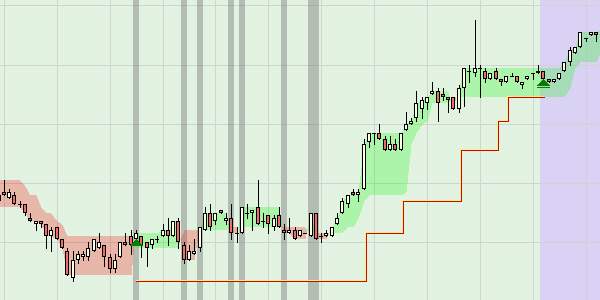
The Longlife stop is designed to allow traders to capture big moves. In the case of a bullish signal, the Longlife Stop is positioned on the lowest price reached by the previous downtrend. The risk is defined by the difference between the entry price and the stop. The Longlife stop remains fixed as long as the price does not close more than once the risk in relation to the entry price. As soon as the price closes above one times the risk, the Longlife stop automatically positions itself at the level of the entry price. At that moment, you cannot lose any more on the position. Then, if the price continues to rise, the Longlife stop follows the price without getting too close so as not to close the position too early. As long as the price doesn't turn sharply, the stop follows without being touched, and we are then able to capture much of the movement as in the following example.

BUILD A TRADING STRATEGY
Equipped with these two effective weapons, we can build our strategy by combining two studies. The first study aims to determine the underlying trend that should not be confused with the short-term trend defined by the bands of the Three Line Break signal. The background trend is defined by the Heikin Ashi indicator in a daily chart. This information is then exported to the second study.
The second study is constructed in a 5-minute graph. It combines the Three Line Break signal, a Flat filter to close any positions at 9:55 pm, the underlying trend from study 1 and a dual stop/target system to diversify the management of the position: a pair of Longlife Fixed Stop and Longlife Fixed Target orders to capture any small movements and a pair of Longlife Stop and Profit Target orders to capture large movements as in the previous example.
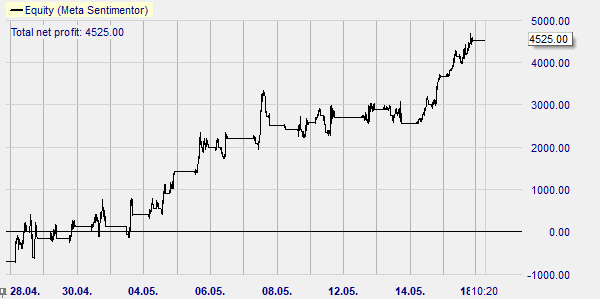
This strategy has been successful for the past few weeks and could continue to be successful as long as the market remains buoyant, as shown by the result of the following back test.

Click on the relevant link to learn more about the Three Line Break signal, the Longlife stop/target, and other strategies.


