Test NanoTrader Full I Test Tradingview I Test the mobile platforms All for CFD-Forex & Futures
You are here
Pullback Scalper, a trading strategy
The Pullback Scalper strategy programmed by Edin Babajic is based on the KISS principle (keep it simple stupid) concept. The strategy focuses on the U.S. market indices (Dow, S&P500, Nasdaq ...). As indicated by its name the strategy is a trend following strategy which tries to identify pullbacks. Pullbacks are short, temporary trend reversals. It is a day trading strategy. Positions are not kept overnight.
| Suitable for | : U.S. market indices (Dow, S&P500 ...) |
| Instruments | : Futures and CFD |
| Trading type | : Day trading |
| Trading tempo | : Several signals every day |
| Using NanoTrader Full | : Manual or semi-automated |
THE STRATEGY IN DETAIL
The Pullback Scalper strategy is traded semi-automatically. The position is opened manually, and closed automatically (see practical implementation below). Signals are generated by a combination of Bollinger Bands and the RSI.
Trend filtering is performed by an exponential moving average (EMA). If the market price is below the EMA, the market is in a negative (bearish) trend and the background of the chart is red. If the market price is above the EMA, the market is in a positive (bullish) trend and the background of the chart is green.
The buy and short sell signals are indicated by triangles in the 3-minute chart. Green triangles denote buy signals, red triangles are short sell signals. Besides these triangles in the chart the user can also have signal alarms via (a) screen pop-ups, (b) e-mails and (c) sound.
WHEN TO OPEN A POSITION?
A long position is bought if the trend is bullish and when the RSI indicates an oversold situation and the candle or bar closes below the Bollinger Band. A short sell position is sold if the trend is bearish and when the RSI indicates an overbought situation and the candle or bar closes above the Bollinger Band. Positions are opened at the market price when the next candle or bar starts.
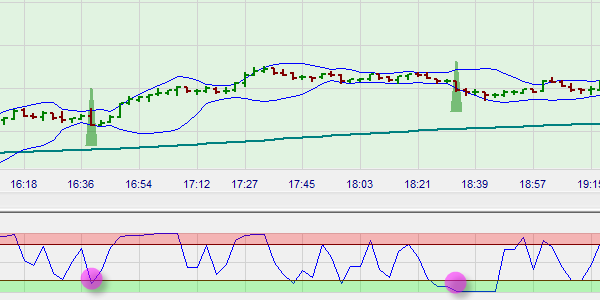
This example shows two buy signals. The trend is bullish (green chart background). The RSI indicates in both cases an oversold situation and the bar closes below the Bollinger Band.
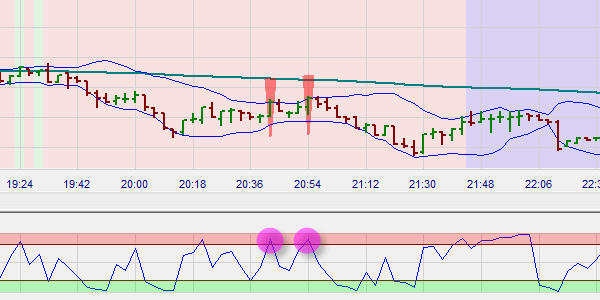
This example shows two short sell signals. The trend is bearish (red chart background). The RSI indicates in both cases an overbought situation and the bar closes above the Bollinger Band.
WHEN TO CLOSE A POSITION?
The Pullback Scalper strategy combines a profit target and a stop loss. Unconventionally the strategy operates with a small return/risk factor of 0,5 only meaning the size of the potential loss is twice the size of the potential profit. This leads to a possibility of many winning trades but these are half the size of a potential loss.
The Pullback Scalper strategy also contains a flat filter. The flat filter automatically closes positions before the end of the market so as to avoid overnight positions.
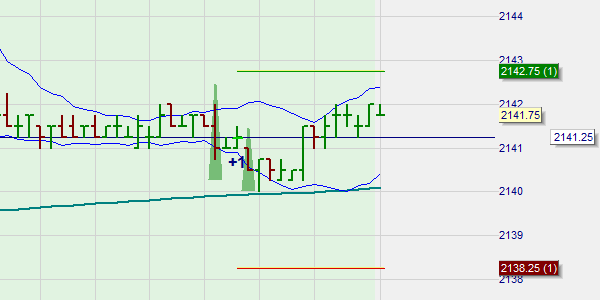
This example shows a long position with the corresponding profit target and stop loss.
CONCLUSION
Although the word scalper features in this strategy's name, it is not a strategy which bombards the trader with signals. Observation seems to show that a first signal is often followed, in quick succession, by a second signal with the second signal being the better of the two. Could one consider it a confirmation signal? Trials on European indices (DAX, CAC ...) appear promising.
Free demo

Trading videos
Charting, strategies, automated trading, backtesting, playback... watch these videos and become a platform master.

Broker
WH SelfInvest serves traders from offices in Germany, France, Switzerland, Belgium, Luxemburg and the Netherlands.
The spectacular SignalRadar
SignalRadar shows live trades being executed by various trading strategies.
More ...
- ‹ previous
- 2 of 5
- next ›