Test NanoTrader Full I Test Tradingview I Test the mobile platforms All for CFD-Forex & Futures
You are here
The 1-2-3-4 chart pattern

The inventor of the 1-2-3-4 chart pattern is trader Jeff Cooper. It is one of the many chart patterns which the NanoTrader can detect automatically.
These are the advantages of the 1-2-3-4 pattern:
- The pattern is designed and used by a famous trader.
- The pattern identifies markets which are breaking out of consolidation.
- The pattern can be used on all instruments. Cooper has a preference for stocks.
- The pattern is easy to understand.
- The pattern provides only buy signals.
- The signals are filtered efficiently by a combination of the ADX and the DMI.
- The historic results of the signals looks attractive.
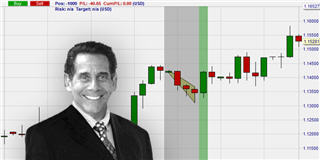
Trader Jeff Cooper
Jeff Cooper started trading in 1981, first for a hedge fund and later for his own account. He lost a significant amount of money during the 1987 market crash. Having learned his lessons from the crash, he only designs strategies which are largely independent of the movement of the overall market.In 1996, Jeff Cooper published his most successful book: “Hit & Run Trading: The Short-Term Stock Traders Bible”. During the internet bubble, Jeff Cooper became an icon for many traders.

Jeff Cooper’s philosophy is based on “price action”. The evolution and the dynamics of the market price are key to him. Indicators are only filters. The assets on his watch list include, in particular, stocks at new highs, stocks breaking out of consolidations, and stocks with attractive levels of volatility. In short, he mainly watches dynamic stocks which are likely to continue to move big time.
The 1-2-3-4 chart pattern
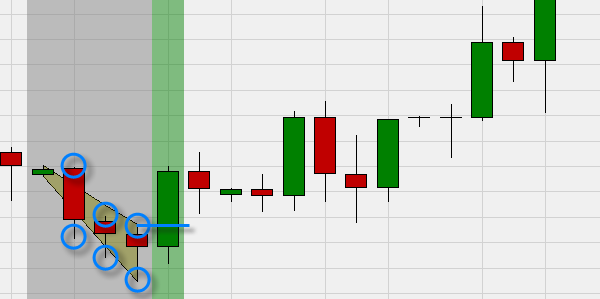
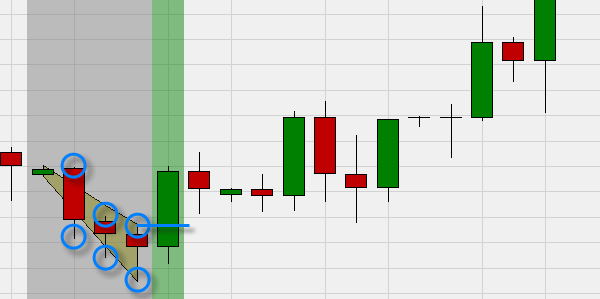
Traders look for this chart pattern on 1-day chart. For a 1-2-3-4 chart pattern to occur there must be at least 3 subsequent lower lows in parallel with at least 3 subsequent lower highs. A position is bought when the market price trades above the high of the last candlestick in the pattern.
in addition to his high and low price criteria Jeff Cooper also defined criteria for the average directional indicator (ADX) and the directional movement indicator (DMI). These criteria filter the signals. The criteria are automatically taken into account by the NanoTrader platform when indicating a valid 1-2-3-4 signal.
Trading examples
This example shows a 1-2-3-4 pattern detected by the NanoTrader. A buy signal (green chart background) appears when the market trades above the high of the last candlestick in the pattern.

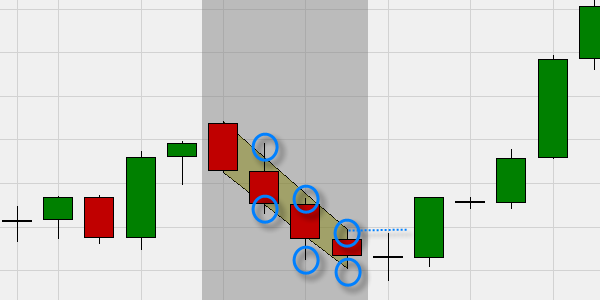
This example shows a 1-2-3-4 pattern detected by the NanoTrader. There is no buy signal because the market did not trade above the high of the last candlestick in the pattern.

Conclusions
The NanoTrader is capable of detecting Jeff Cooper's 1-2-3-4 chart pattern. The pattern can be used in screeners, signals and strategies.
People also read
- Jeff Cooper, Hit & Run trader
- The Hikkake pattern – Daniel L. Chesler
- Automatically detecting chart patterns
Recommended broker
Recommended managed account service


