Test NanoTrader Full I Test Tradingview I Test the mobile platforms All for CFD-Forex & Futures
You are here
Automated drawing of Fibonacci levels

In theory drawing Fibonacci levels is simple. In practice it is not that simple. Why? Firstly the trader needs to identify a trend. Secondly the trader needs to observe the trend and decide when the trend has ended so he can draw the Fibonacci levels. The automated drawing package solves these two complexities. It identifies the trends and draws the Fibonacci levels and the Fibonacci extensions when it considers the trend has ended.
The advantages of the automated Fibonacci drawing tool are:
- The Fibonacci levels are drawn automatically.
- The Fibonacci extensions are drawn automatically.
- You can choose between 4 solid trend indicators to base the Fibonacci levels on.
- The rare Fibonacci levels based on time are also available.
- The tool is free.
- No programming required.
1. FIBONACCI LEVELS
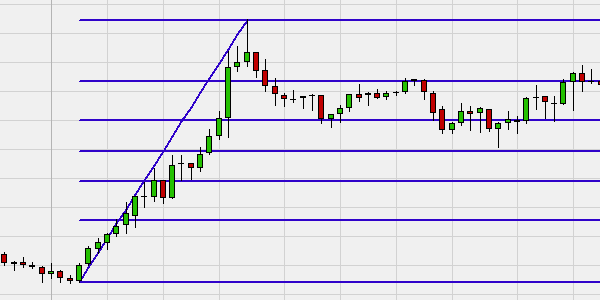
Fibonacci levels are obtained by connecting the highest and the lowest point of a trend, after the trend has ended. The Fibonacci levels are used by traders as support/resistance levels after the trend change.
This example shows the Fibonacci levels after a positive (bullish) trend. The Fibonacci levels (the horizontal blue lines) based on the trend are obtained by connecting the lowest and the highest point of the trend when the trend has ended.
2. FIBONACCI EXTENSIONS
In addition to Fibonacci levels there are also Fibonacci extensions. Fibonacci extensions are used by traders as price targets once the market moves outside the Fibonacci levels.
3. THE MARKET TREND
Traders can choose between 4 technical analysis tools which the NanoTrader will use to draw the Fibonacci levels and extensions automatically:
- The SuperTrend indicator.
- The Univers-Bourse trend detector.
- Crossing moving averages.
- Exponential moving average and market price cross.
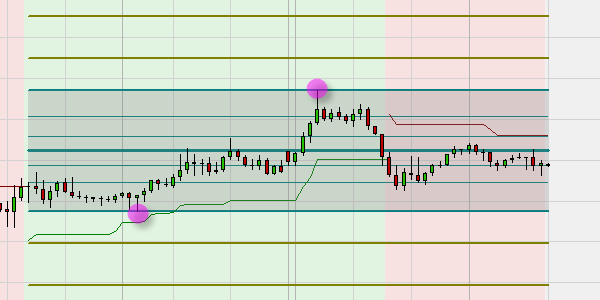
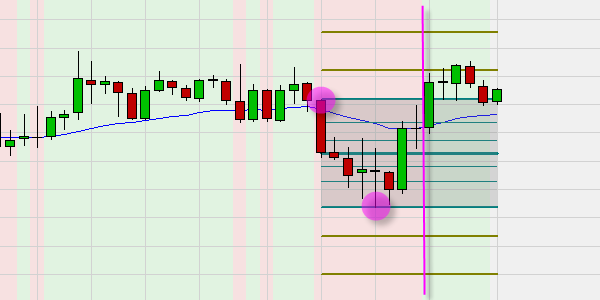
This example shows the SuperTrend indicator. If the SuperTrend is bullish, the chart background is green. If the SuperTrend is bearish, the chart background is red. The last completed trend was bullish (green). The Fibonacci levels and extensions are automatically drawn when the trend ends. They are based on the high and the low point of the completed trend.
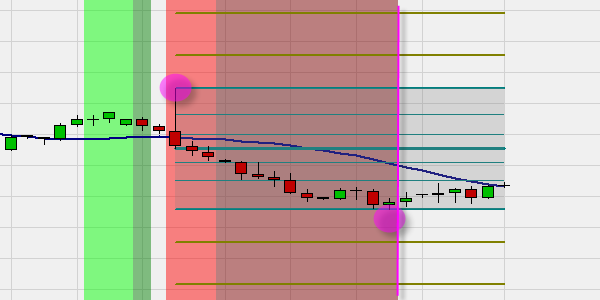
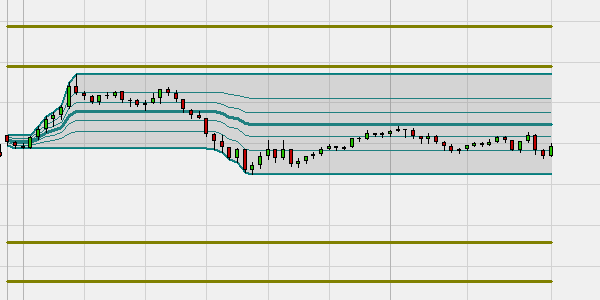
This example shows the Univers-Bourse trend detector. Light green (or light red) is the start of a trend, dark green (or red) is the confirmation of a trend and white is sideways and thus also the end of the trend. The last completed trend was bearish. The Fibonacci levels and extensions were automatically drawn when the trend ended. They are based on the high and the low point of this completed trend.
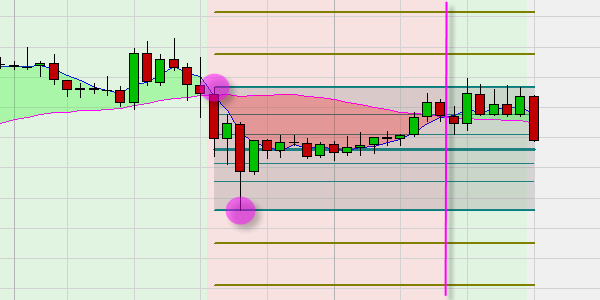
This example shows crossing moving averages to determine the trend. If the trend is bullish, the chart background is green. If the trend is bearish, the chart background is red. The last completed trend was bearish (red). The Fibonacci levels and extensions were automatically drawn when this trend ended and are based on the high and the low point of this completed trend.
4. This example shows the cross between an exponential moving average and the market price used to determine the trend. If the trend is bullish, the chart background is green. If the trend is bearish, the chart background is red. The last completed trend was bearish (red). The Fibonacci levels and extensions were automatically drawn when this trend ended. They are based on the high and the low point of this completed trend.
4. FIBONACCI LEVELS BASED ON TIME
Traders can choose between 5 time frames which the package can use to draw the Fibonacci lines and extensions automatically:
- Day
- Week
- Month
- Quarter
- Year
This example shows Fibonacci levels based on the current week. It is Tuesday so the Fibonacci levels are based on the high and low of Monday and Tuesday. The extensions are always drawn based on last week’s Fibonacci levels.
Below the main chart, the Fibonacci levels and extensions based on last week’s high and low are also shown. Some traders use this time-based variant but it is not common.
Free demo

Trading videos
Charting, strategies, automated trading, backtesting, playback... watch these videos and become a platform master.

Broker
WH SelfInvest serves traders from offices in Germany, France, Switzerland, Belgium, Luxemburg and the Netherlands.
The spectacular SignalRadar
SignalRadar shows live trades being executed by various trading strategies.
More ...
- ‹ previous
- 2 of 5
- next ›