Test NanoTrader Full I Test Tradingview I Test the mobile platforms All for CFD-Forex & Futures
You are here
Identify the market trend
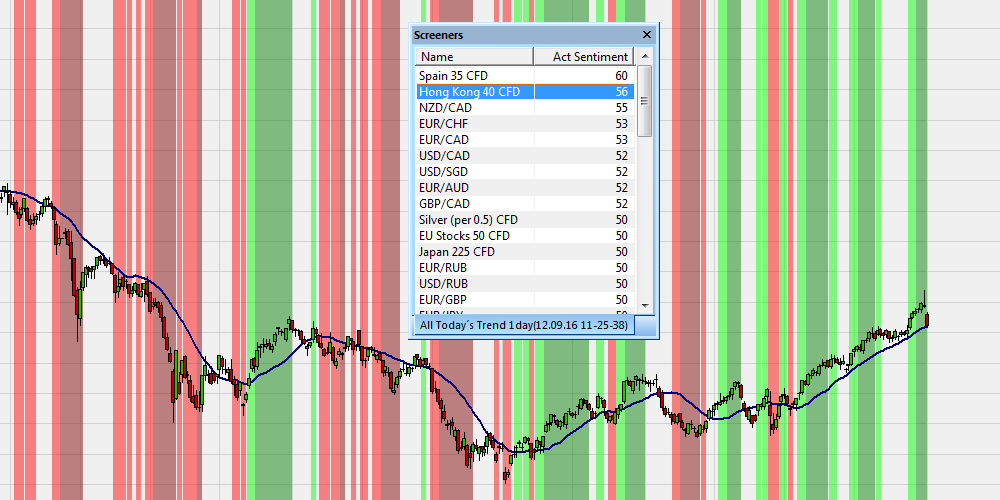
The NanoTrader contains a trend screener called "All Today’s Trends". The screener not only identifies if a trend exists but it also indicates since when it exists and how strong it is.
These are the advantages of the Today’s Trends screener:
- The screener can be applied to all markets (stocks, indices, forex ...).
- Both bullish and bearish trends are identified.
- The starting point of the trend is identified.
- The duration/strength of the trend is indicated.
- Present and past trends are visible in the chart, which is linked to the results table.
- The end of the trend is identified.
- The screener is easy to use.
Test this screener: downnload a free real-time demo of the NanoTrader Full
1. SCREENER RESULTS
The results of the screener are shown in a table. Markets with a sentiment of 50 are considered to display no trend. Markets with a sentiment >50 are in a positive (bullish) trend. Markets with a sentiment <50 are in a negative (bearish) trend.
The higher the sentiment, the longer a market has been in bullish trend. The lower the sentiment, the longer the market has been in a bearish trend.
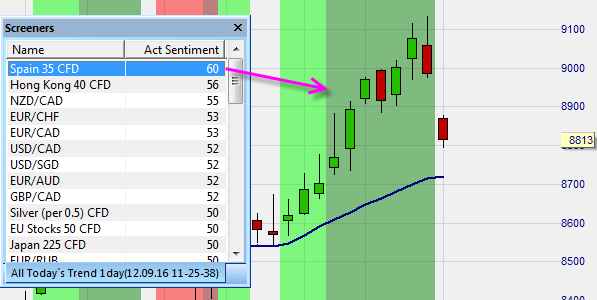
This example shows the markets which are in a bullish trend (sentiment > 50). The Spanish index has been in a bullish trend for 10 consecutive days.
Free real-time NanoTrader demo
This example shows the markets which are in a bearish trend (sentiment < 50). The Australian market has been in a bearish trend for 12 consecutive days.
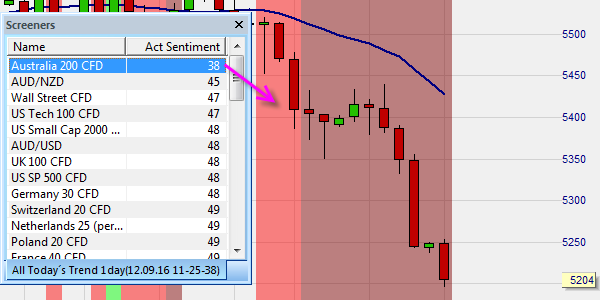
Tip: the table and the chart are linked. Click an instrument and the chart changes.
Free real-time NanoTrader demo
2. THE START OF A TREND
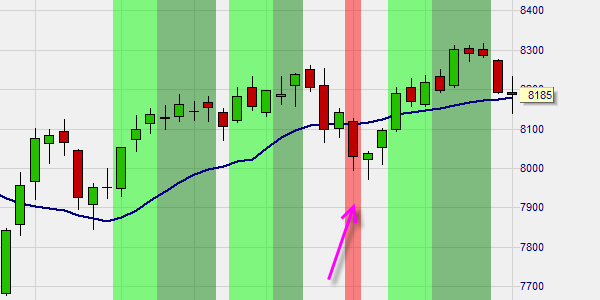
Once the screener identifies the beginning of a trend, it will increase the sentiment to 51 for a bullish trend or reduce it to 49 for a bearish trend. In addition a green (bullish) or red (bearish) vertical bar is shown in the chart chart.
This example shows the point in time where the screener considered a bearish trend may start. A vertical red bar was added to the chart. The trend did not occur according to the screener criteria and therefore no further colour was added to the chart.
Free real-time NanoTrader Demo
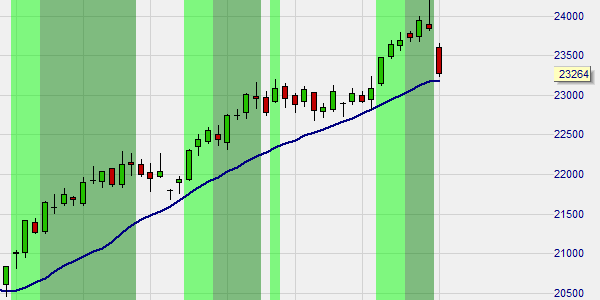
3. THE DURATION/STRENGTH OF A TREND
If the screener considers the trend confirmed, it will darken the background colour in the chart after three days.
This example shows three confirmed bullish trends for the Hong Kong market index.
Free real-time NanoTrader Demo
Professional trader and author Bernard Prats-Desclaux likes the NanoTrader trading platform. He offers his GTAS trading strategy for free in the NanoTrader.

Discover the NanoTrader platform... download a free real-time demo.
Free demo

Trading videos
Charting, strategies, automated trading, backtesting, playback... watch these videos and become a platform master.

Broker
WH SelfInvest serves traders from offices in Germany, France, Switzerland, Belgium, Luxemburg and the Netherlands.
The spectacular SignalRadar
SignalRadar shows live trades being executed by various trading strategies.
More ...
- ‹ previous
- 2 of 5
- next ›