Test NanoTrader Full I Test Tradingview I Test the mobile platforms All for CFD-Forex & Futures
You are here
Jeff Cooper, Hit & Run trader
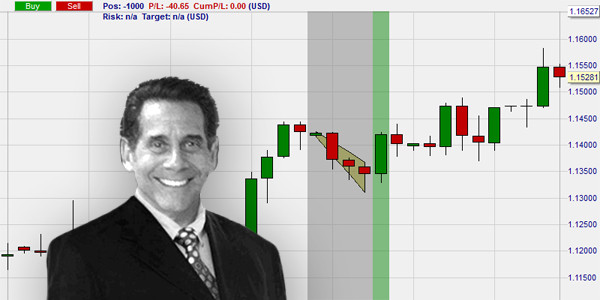
Jeff Cooper began trading in 1981, first for a hedge fund and then for his own account. He lost a considerable amount of money during the financial crisis of 1987. Learning from this experience, Jeff Cooper only developed trading approaches that were largely independent of the general market situation. In 1996 he published his most successful book: "Hit & Run Trading: The Short-Term Stock Traders Bible". During the period of the Internet bubble, Jeff Cooper became an icon for many traders.
Related to Jeff Cooper and available free of charge in the NanoTrader (free demo) trading platform:
1. Trading strategies and signals
–
2. Trading chart patterns
The 1-2-3-4 chart pattern
3. SignalRadar (more)
Yes
Trader Jeff Cooper
Philosophy
Jeff Cooper started trading in 1981, first for a hedge fund and later for his own account. He lost a significant amount of money during the 1987 market crash. Having learned his lessons from the crash, he only designs strategies which are largely independent of the movement on the overall market. In 1996, Jeff Cooper published his most successful book: “Hit & Run Trading: The Short-Term Stock Traders Bible”. During the internet bubble, Jeff Cooper became an icon for many traders.
Cooper’s philosophy is based on “price action”. The evolution and the momentum of the market price are key to him. Indicators only serve as filters. The assets on his watch list include, in particular, stocks at new highs, stocks breaking out of consolidations, and stocks with attractive levels of volatility. Thus, he mainly watches dynamic stocks which are likely to continue to make big moves.
The advantages of Jeff Cooper's chart pattern :
- The pattern can be used on all instruments. Jeff Cooper prefers stocks.
- The pattern is easy to understand.
- Signals are efficiently filtered by a combination of ADX and DMI.
- Past performances seem quite promising.
The 1-2-3-4 chart pattern
For a valid 1-2-3-4 chart formation pattern there must be at least 3 subsequent lower lows and at least 3 subsequent lower highs. Once the market price trades above the high of the last candle in the pattern, a position is bought at the market price.
The pattern is defined as follows...
- Identifies markets which are breaking out of consolidation.
- Is used on charts in a 1-day time frame (you can experiment with other time frames).
- Can be used on all instruments.
- Provides only buy signals.
Recommended broker
Examples
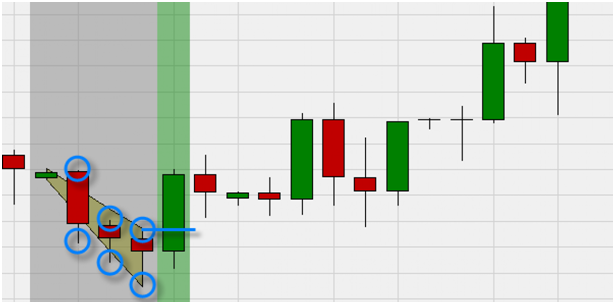
This example shows a 1-2-3-4 pattern detected by the NanoTrader platform (free demo). A buy signal (= green vertical bar in the chart background) appears when the market trades above the high of the last candlestick in the pattern.
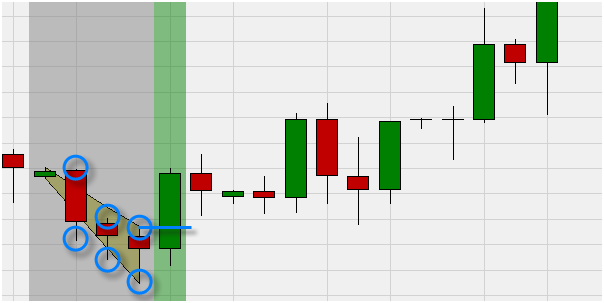
This example shows another 1-2-3-4 pattern detected by the NanoTrader (free demo). There is no buy signal because the market did not trade above the high of the last candlestick in the pattern.
In addition to his high and low price criteria Jeff Cooper also defined criteria for the Average Directional Indicator (ADX) and the Directional Movement Indicator (DMI). These criteria filter the signals. The criteria are automatically taken into account by the NanoTrader platform when indicating a valid 1-2-3-4 signal.
People also read
If you are looking for a good managed account, check out this service...
Free demo

Trading videos
Charting, strategies, automated trading, backtesting, playback... watch these videos and become a platform master.

Broker
WH SelfInvest serves traders from offices in Germany, France, Switzerland, Belgium, Luxemburg and the Netherlands.
The spectacular SignalRadar
SignalRadar shows live trades being executed by various trading strategies.
More ...
- ‹ previous
- 2 of 5
- next ›