Test NanoTrader Full I Test Tradingview I Test the mobile platforms All for CFD-Forex & Futures
You are here
Pivot Points in Forex Trading

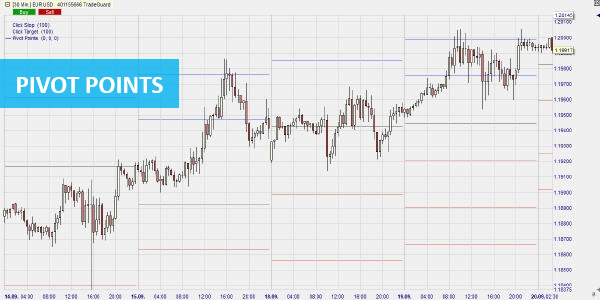
The pivot points are based on the highest price (H), lowest price (L) and closing price (C) of the previous day. As soon as the trader selects this instrument, NanoTrader automatically calculates the daily pivot points. Many forex traders work with this technical analysis tool or implement their strategies based on pivot points. The reason is simple: pivot points are used by banks and other institutional market players. Some of them even use the pivot points to base their trading decisions. This is reason enough to be interested in the pivots.
Advantages of the pivot function in NanoTrader:
- Nanotrader automatically calculates the pivot points for each trading day.
- Pivot points can be displayed as sub-windows in the master chart.
- Pivot points can be configured individually (color, style, size).
- The trader can choose which of the pivot points are displayed. For example, if R3 is not needed, it can be left out.
Click here to test a free real-time demo of NanoTrader Full.
EXAMPLE OF A TRADE WITH PIVOT POINTS IN EUR/USD

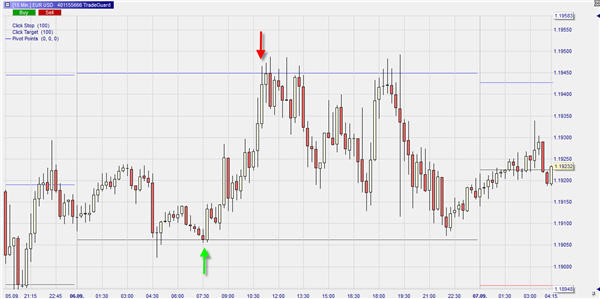
We can see on the left side of the 15-minute chart that the EUR/USD was trading around the pivot early in the morning (lower black horizontal line). After the second contact with the pivot (green arrow below on the left), the trader could enter a long position with a price target on R1 (blue horizontal line above). The target is reached at 11 a.m.. As you can see the price on that day tried five times to cross above R1. Since this failed, the trader had ample opportunity to go short on R1 with the pivot as target. This target was then actually almost reached in the late evening.
Of course it is not always so smooth. If the price overcomes for example R1 and continues toward R2 or even R3 the trend is clearly bullish. To take short positions prematurely here would lead to losing positions. As a rule, pivot traders also place their stops at the next line. For example, if you go long on S1, the stop will usually be on S2. The price target would then be the pivot. The great advantage of pivot trading is obvious: the clear configuration allows you to define precisely where the stops and objectives should be placed.
PIVOT AS A SENTIMENT INDICATOR
In general, a price above the pivot is considered bullish, while a price below the pivot is considered bearish. If the market turns over the pivot, it can generally be said that the sentiment of market participants has turned from short to long. This is, of course, an important indication as to whether the trader should opt for long or short positions.
However, this definition should not be applied too broadly. In intraday trading it can make sense to buy on the S1 with a target on the pivot if clear support develops on S1. Every pivot trader has developed his own strategies on how best to use the pivot points.
WHERE TO FIND THE PIVOT POINTS-FUNCTION IN NANOTRADER?

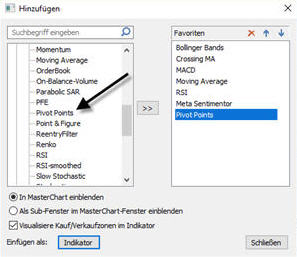
The function can be easily added by clicking on the "Add indicator" icon in NanoTrader. The window above will open. Click on "Indicators" on the left and select "Pivot Points". Then you can choose whether you want to display the pivot points in the master chart or in a sub-window.
Professional Trader "Koko" Petkov about NanoTrader...

Click here to test a free real-time demo of NanoTrader Full.


