Test NanoTrader Full I Test Tradingview I Test the mobile platforms All for CFD-Forex & Futures
You are here
Success with Renko charts
The Renko chart is a popular chart type used when you only want to show the price movement of a financial asset. The term "Renko" is derived from the Japanese word "Renga" which stands for brick. Therefore, the Renko charts are created from a series of stones or blocks that move up and down like other charts.
"NanoTrader offers all the important movement-only charts as used by the majority of experienced traders. Regarding regular time-based charts, NanoTrader allows traders to choose any time frame. Most platforms only have a set menu of standard time frames to choose from." - Pascal
The advantages of using Renko charts:
- Simple to use and easy to interpret.
- Ideal for determining support and resistance levels.
- The size of the "blocks" can be adjusted to the trading needs of a trader.
- Renko charts are excellent for identifying breakouts and reversals.
- Only price movement is shown,
CALCULATING RENKO CHARTS
As with Range Bars, the Renko Chart represents only the extent of a price movement, regardless of time. The Renko Chart is constructed by equal-sized Renko blocks (bricks), in which a new block (brick) is only drawn when the current price exceeds or falls below the current high or low by a certain value. The size of the blocks is determined by the trader. A new block is only formed when the price is above or below the given block size. The effectiveness of the Renko charts therefore depends on how they are calculated.
There are two main methods to calculate the size of the blocks. The Average True Range (ATR) method uses the ATR indicator to calculate the ATR value in a regular candlestick graph. The result of this calculation is the block size. In the second approach, the trader uses a predefined value for the block size. New blocks are usually created if the price movement is at least as large as the block size.
HOW TO USE RENKO CHARTS
After you have determined the size of the block, you should apply it to the chart. The default chart will then be replaced and you can perform the analysis.
Buy signals
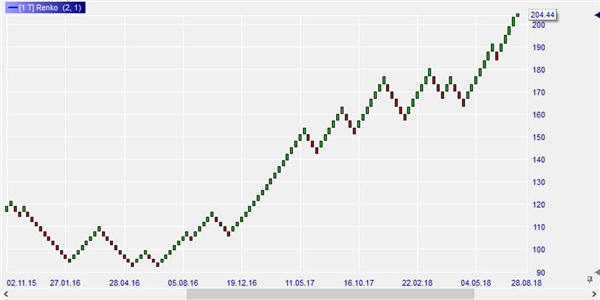
Picture 1: Renko chart Apple stock.
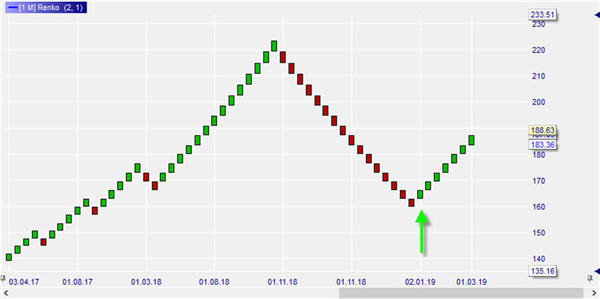
A buy signal using the Renko chart is identified in two ways. First, the color of the blocks tells you when to buy and when to sell. Figure 1 shows the monthly chart of Apple stock since April 2017. The green bricks indicate upwards movementm the red bricks indicate downwards movement. The stock has clearly been in an upward trend since 2017. There were short corrections in which the trader was able to take profits in order to enter again with the next buy-signal (change of color). At the end of 2018 there was a major correction in Apple, which of course could be used by a short trader. At the beginning of 2019, the color changed again from red to green. A new buy signal (arrow) apppeared.
Short sell signals
Picture 2: Renko chart EUR/USD.
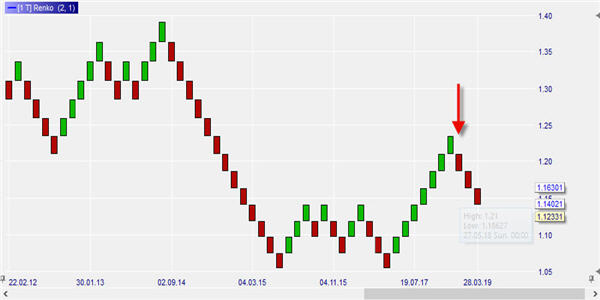
The EUR/USD pair bottomed in the range 1.0500 - 1.1500 in 2015-2016, from where it began to rise again in 2017, but only reached a high in the 1.2300 range. From this level, the pair generated a new short sell-signal (arrow).
Both these examples show the Renko charts used in isolation for clarity's sake. Traders will usually combine them with other technical analysis tools.
CONCLUSION
Renko charts are ideal for gaining a quick and easy overview of a market or stock. They can be used independently or together with other indicators, especially when support and resistance levels are determined. The key to success in using this chart type is to know how to calculate the size based on your trading preferences.

Free demo

Trading videos
Charting, strategies, automated trading, backtesting, playback... watch these videos and become a platform master.

Broker
WH SelfInvest serves traders from offices in Germany, France, Switzerland, Belgium, Luxemburg and the Netherlands.
The spectacular SignalRadar
SignalRadar shows live trades being executed by various trading strategies.
More ...
- ‹ previous
- 2 of 5
- next ›