Test NanoTrader Full I Test Tradingview I Test the mobile platforms All for CFD-Forex & Futures
You are here
Trading a forecast (e.g. FXStreet)
The question is simple: if today the market price is, say, 100 and the forecast is 110 at the end of the week, what is the best way to trade this expected movement? There is no best way to trade a forecast. There are various ways. The choice will depend on parameters such as the time the trader is willing to put in, the risk the trader is willing to take, the trader’s preferred trading style and, last but not least, the capabilities of his trading platform.
The advantages of NanoTrader to trade forecasts are:
- Trading can be done manually, semi-automatically and automatically.
- The trader can set the proportion of his chart dedicated to the future.
- The trader can use horizontal lines but also trade lines, trade channels etc.
- The trader can set himself all interpretations for when to go long, short and close.
- No programming is required.
This article details several possibilities on how to trade a market forecast. To do so a practical example is used. The practical example is a EUR/USD forecast from the website FXStreet.
Download a free real-time demo of the NanoTrader Full trading platform
1. A PRACTICAL EXAMPLE
FXStreet (fxstreet.com) is a forex website which publishes Friday afternoon at 15h00 GMT forecasts for a range of forex pairs. The FXStreet forecast consists of a weekly, monthly and quarterly forecast, including a bullish/bearish bias.
This example shows the FXStreet forecast for the EUR/USD.
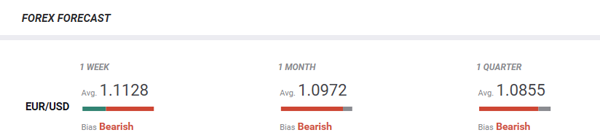
Tip: when selecting forex pairs based to trade, select forex pairs which have an identical bias for every forecast horizon. The EUR/USD forecast from FXStreet has a bearish bias for every horizon.
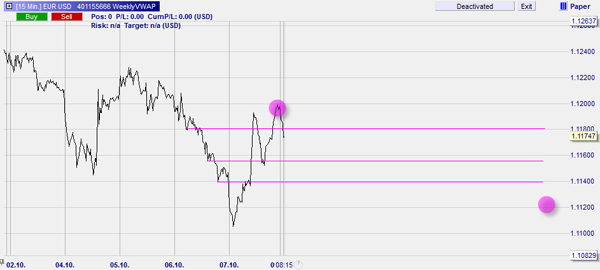
The FXStreet forecast for the week published Friday afternoon is 1,1128. The EUR/USD closed at 1,1196 at the end of the day. The forecast movement corresponds to -68 pips or $ 680 when trading a standard EUR/USD contract. This is what the forecast looks like on a chart:
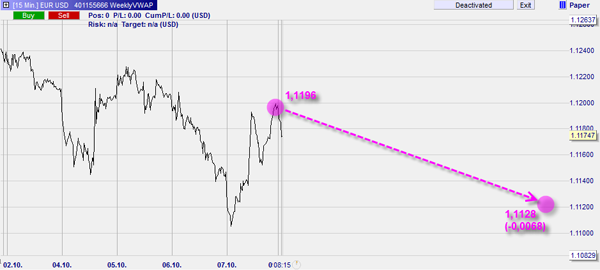
Important: in NanoTrader it is possible to set n% of the chart to the future. This trader sets 50%. The chart space for last week and the week to come are therefore identical. This allows the trader to draw into the space dedicated to the future.
2. HOW TO TRADE THE FXSTREET FORECAST
2.1 THE SIMPLE SOLUTION
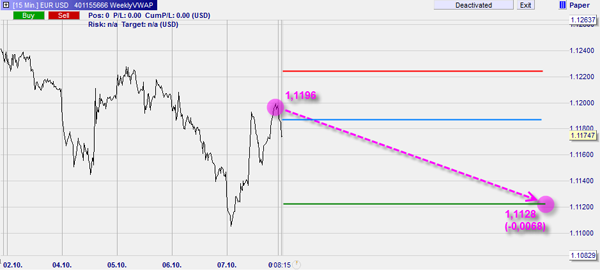
The simple solution consists of placing a sell stop order some distance below Friday’s close. If the position is opened, place a stop loss order and a target order. The target order is placed on the FXStreet forecast of 1,1128.
In the example of the FXStreet EUR/USD forecast the simple solution looks like this. The blue line is the entry, the green line is profit target and the red line is the stop.
2.2 USING SUPPORT/RESISTANCE LEVELS
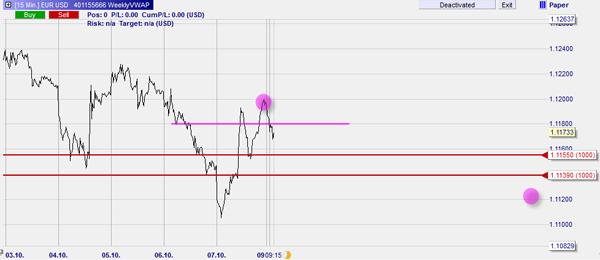
A second possibility to trade the forecast is to identify support/resistance levels in last week’s chart. When resistance levels are broken, the market often accelerates. The number of levels identified can vary.
In the example of the FXStreet EUR/USD forecast the trader identified three resistance levels. One of these levels has already been broken.
2.3 USING FIBONACCI LEVELS
Traders with a preference for Fibonacci can use the Fibonacci levels to trigger positions.
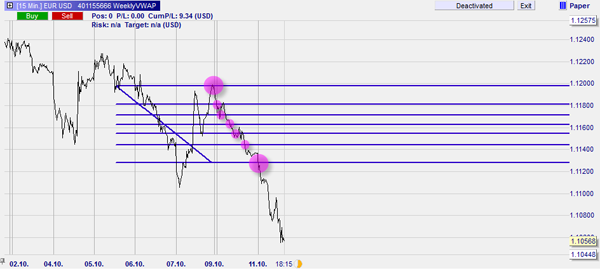
In the example of the FXStreet EUR/USD the 5 Fibonacci levels relevant for trading, are visible. The highest Fibonacci level has already been broken.
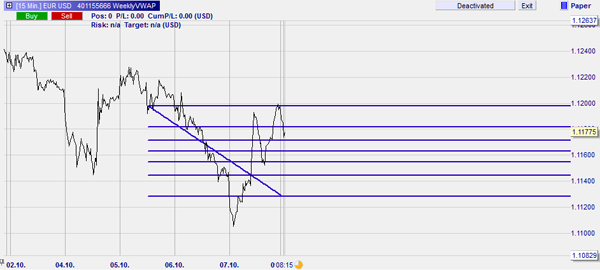
Tip: to draw the Fibonacci levels go to Wednesday around midday and at the level of the Friday close (1,1196). Draw the diagonal to the time of the Friday close at the level of the FXStreet forecast (1,1128). The top line is thus at the close level 1,1196 and the bottom line is at the forecast level 1,1128. This results in 5 relevant Fibonacci levels.
2.4 USING A TRADING LINE
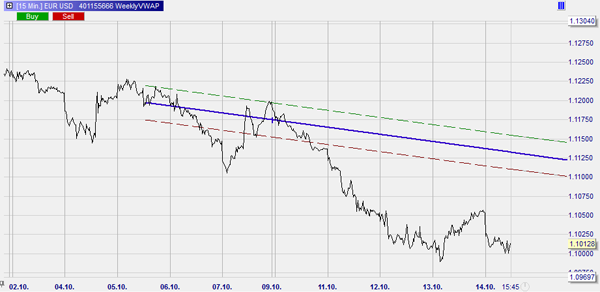
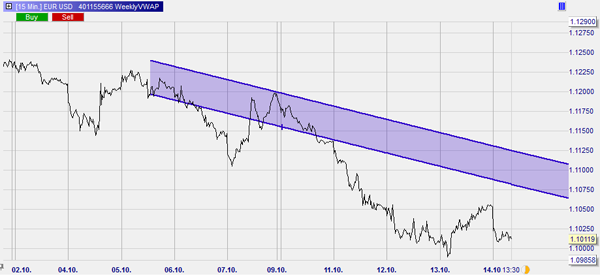
The fourth possibility is to draw a trading line. The trading line connects the forecast level and a point in the previous week’s chart. Different possibilities offer themselves to select this point. One could use the week’s VWAP, the mid-week price, etc.
In the FXStreet EUR/USD example the forecast is below the current market price. The trader opens short sell positions when the market enters into the upper range. The position is closed when the trading line is hit.
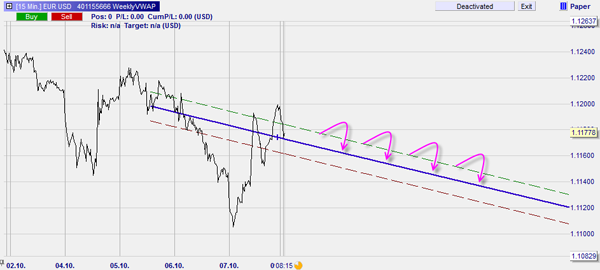
Tip: there is no fixed rule on how to draw the trading line. Different possibilities offer themselves to select which price point to connect to the forecast. One could use the week’s VWAP, the mid-week price, etc.
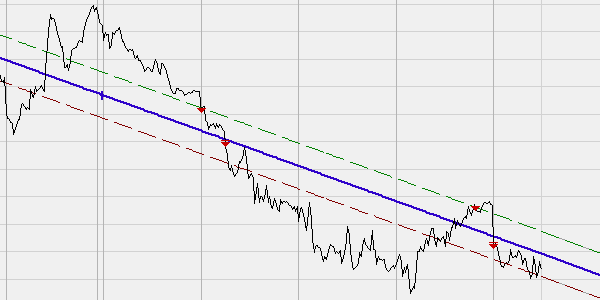
2.5 USING A TRADING CHANNEL
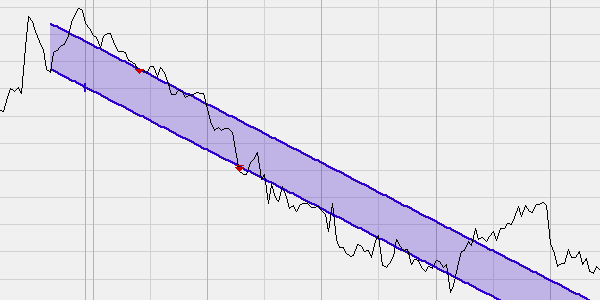
A fifth possibility consists of drawing a trading channel. Every time the market comes back into the channel the trader opens a short position. The profit target is the bottom of the trend channel.
In the example of the FXStreet EUR/USD forecast this is what the trend channel looks like.
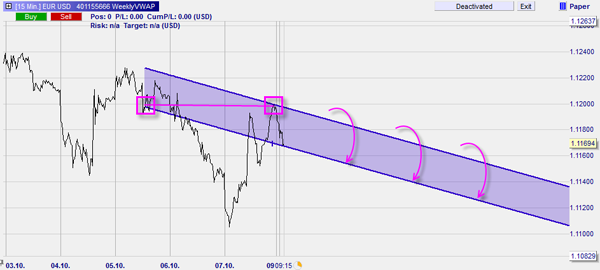
Tip: to draw the trend channel go to Wednesday around midday and at the level of the Friday close (1,1196). The other side of the channel goes through the same price level on Friday. The middle of the trend channel ends on the FXStreet forecast level (1,1128).
3. PRACTICAL IMPLEMENTATION
3.1 THE SIMPLE SOLUTION
Settings
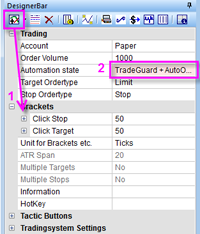
1. Add a ‘click stop’ and a ‘click target’ and parameter a distance fairly far from the market price.
2. Activate the TradeGuard. When you open a position, the NanoTrader will place the stop and target orders automatically.

3. At the start of the week, place a buy stop (in case of a positive forecast) somewhat above the market price or place a sell stop order (in case of a negative forecast) somewhat below the market price.
4. Once a position is opened, slide the target order (which the TradeGuard will place automatically for you if activated) to the forecast level. Do so by clicking the arrow in front of the order label and sliding the target order to the forecast level.
5. Once a position is opened, slide the stop order (which the TradeGuard will place automatically, if activated) to a stop level of your choice. In the chart click the arrow in front of the order label and slide the stop order to level of your choice. You can, for example, select a level based on the previous week’s chart or you can put it at a level where your return/risk ratio (RRR) is at least one. You can see the RRR in the chart and in the account bar.
In the example of the FXStreet EUR/USD forecast it would look like this:

3.2 USING SUPPORT/RESISTANCE LEVELS
Settings:
1. Add a ‘click stop’ and a ‘click target’ and enter a distance fairly far from the market price.
2. Activate the TradeGuard. When you open a position, the NanoTrader will place the stop and target orders automatically.
3. At the start of the week, in case of a positive forecast, place buy stop orders on all the resistance levels of the previous week. In case of a negative forecast, place short sell stop orders on all the support levels of the previous week.
4. Once a position is opened, slide the target order (which the TradeGuard will place automatically for you if activated) to the forecast level. Do so by clicking the arrow in front of the order label and sliding the target order to the forecast level.
5. Once a position is opened, slide the stop order (which the TradeGuard will place automatically, if activated) to a stop level of your choice. In the chart click the arrow in front of the order label and slide the stop order to level of your choice. You can, for example, select a level based on the previous week’s chart or you can put it at a level where your return/risk ratio (RRR) is at least one. You can see the RRR in the chart and in the account bar. If any subsequent entry orders are triggered because the market moves in the forecasted direction, you can slide the stop again.
Note: If the entry orders are triggered at their different levels, the NanoTrader will automatically increase the quantity of the stop loss order and the target order to reflect the increased position size.
In the example of the FXStreet EUR/USD forecast the trader placed two stop sell orders. The first level was already broken before he could place his orders. It would be possible to place a sell limit order at this level so a short position is opened should the market move back up to that level.
3.3 USING FIBONACCI LEVELS
How to draw the Fibonacci levels is explained above.
Settings:
1. Add a ‘click stop’ and a ‘click target’ and enter a distance fairly far from the market price.
2. Activate the TradeGuard. When you open a position, the NanoTrader will place the stop and target orders automatically.

3. At the start of the week, in case of a positive forecast, place buy stop orders on all the Fibonacci levels. In case of a negative forecast, place short sell stop orders on all the support levels of the previous week.
4. Once a position is opened, slide the target order (which the TradeGuard will place automatically, if activated) to the FXStreet forecast level. Do so by clicking the arrow in front of the order label and sliding the target order to the forecast level.
5. Once a position is opened, slide the stop order (which the TradeGuard will place automatically if activated) to a stop level of your choice. In the chart click the arrow in front of the order label and slide the stop order to level of your choice. You can, for example, select a level based on the previous week’s chart or you can put it at a level where your return/risk ratio (RRR) is at least one. You can see the RRR in the chart and in the account bar. If any subsequent entry orders are triggered because the market moves in the forecasted direction, you can slide the stop again.
Note: If subsequent entry orders are triggered at the different Fibonacci levels, the NanoTrader will automatically increase the quantity of the stop loss order and the target order to reflect the increased position size.
In the example of the FXStreet EUR/USD forecast the trader opened 5 short sell positions, reaching the forecast target on Tuesday morning.
3.4 USING A TRADING LINE
How to draw the trading line is explained above.
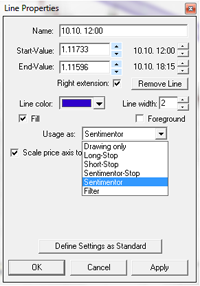
1. Draw the trading line and select “sentimentor” for its use.
2. It is possible to change the distance of the bands to the trading line.
3. Add the metasentimentor.
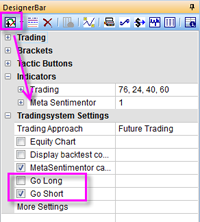
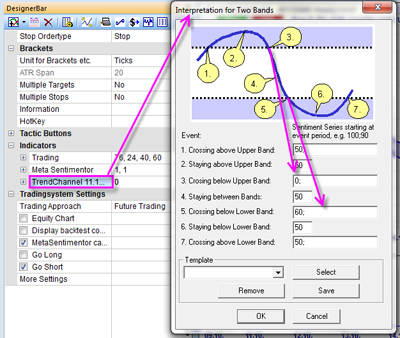
4. Select either “Go long” or “Go Short” in the Tradingsystem Settings depending on the direction of the forecast. In the FXStreet example the forecast is below the Friday close so we select go short.
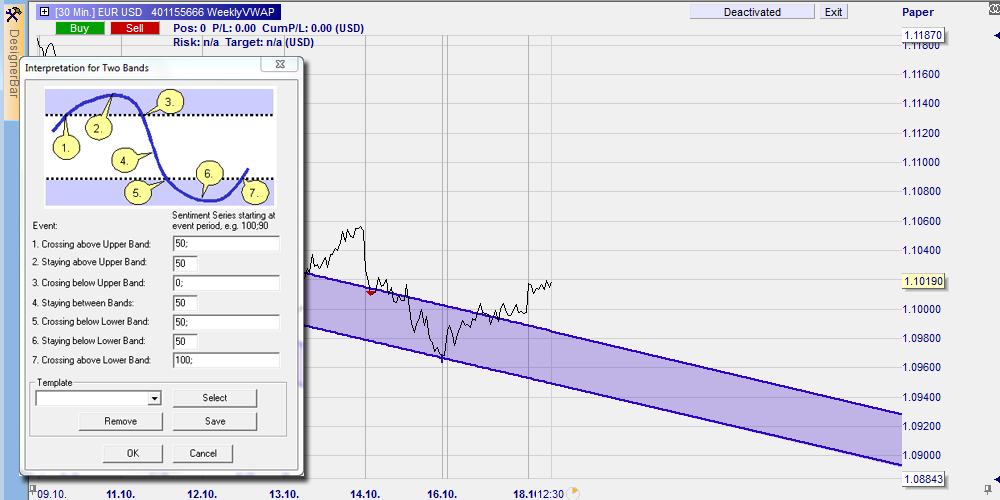
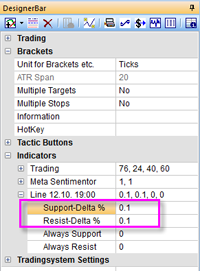
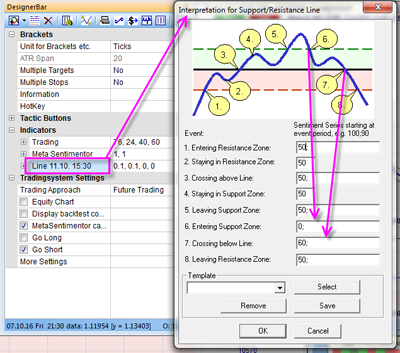
5. Double click the channel box to set the interpretation (0 is short, 100 is long, 50 is neutral, 40 is close long and 60 is close short) for the (semi-)automated trading. Set box 6 to 0 to go short when the market price enters the top band and set box 7 to 60 to close the position when the bottom of the channel is reached. The other values can be put to 50. Users can decide on other interpretations.
6. Activate TradeGuard if you want to open the position manually and let the platform close the position. Activate AutoOrder if you want the platform to open and close the position.
In the example of the FXStreet EUR/USD forecast the market never traded in the band hence no trades were triggered.
In this example the market goes in and out of the upper band twice, resulting in two trades.
3.5 USING A TRADING CHANNEL
How to draw the trend channel is explained above.
1. Draw the trend channel and select “sentimentor” for the use.

2. Add the metasentimentor.
3. Select either “Go long” or “Go Short” in the Tradingsystem Settings depending on the direction of the forecast. In the FXStreet example the forecast is below the Friday close so we select go short.

4. Double click the channel box to set the interpretation (0 is short, 100 is long, 50 is neutral, 40 is close long and 60 is close short) for the (semi-)automated trading. Set box 3 to 0 to go short when the market price enters the channel and set box 5 to 60 to close the position when the bottom of the channel is reached. The other values can be put to 50. Users can decide on other interpretations.
5. Activate TradeGuard if you want to open the position manually and let the platform close the position. Activate AutoOrder if you want the platform to open and close the position.
In the example of the FXStreet EUR/USD forecast the market never entered the trend channel from the top. Hence no trades were triggered.
In this example the market goes into the trend channel and a position is opened. The position is closed when the market hits the bottom of the trend channel.
The experiences of some traders with broker WH SelfInvest...

NanoTrader is my fourth trading platform and it is by far the best. – H.B.
It is incredible what your trading platform can do. – N.R.
NanoTrader is a reliable and robust trading platform. – C.U.
The NanoTrader leaves no desire unmet. – W.G.
Download free e-books on trading in the library.
Improve your trading... test the incredible NanoTrader trading platform.
Free demo

Trading videos
Charting, strategies, automated trading, backtesting, playback... watch these videos and become a platform master.

Broker
WH SelfInvest serves traders from offices in Germany, France, Switzerland, Belgium, Luxemburg and the Netherlands.
The spectacular SignalRadar
SignalRadar shows live trades being executed by various trading strategies.
More ...
- ‹ previous
- 2 of 5
- next ›