Test NanoTrader Full I Test Tradingview I Test the mobile platforms All for CFD-Forex & Futures
You are here
Trading the FXStreet forecast
The question is simple: let's say today's price is 100 and by the end of the week we forecast a price of 110, what is the best way to trade this expected move? There is no best way to trade a forecast. There are different ways. The choice will be based on several parameters, such as the time you are willing to invest, the risk you want to take, your preferred trading style and last but not least the possibilities of your trading platform.
NanoTrader offers the following advantages when trading a forecast:
- The trader can trade manually or (semi)-automatically.
- The trader can set how much space in the chart is kept empty for the chart being drawn.
- The trader can use horizontal lines, trend lines, trend channels, etc.
- Programming is not required.
The EUR/USD forecast published by FXStreet
This article shows some possibilities to trade forecasts. A practical example is used. The practical example is a EUR/USD forecast from the website FXStreet.
The forex forecast
FXStreet (fxstreet.com) is a Forex website that publishes forecasts for the possible price range of some Forex contracts on Fridays at 15:00 UTC. The FXStreet forecast consists of a weekly, monthly and quarterly forecast, including a bullish/bearish bias.
This example shows the FXStreet forecast for the EUR/USD.
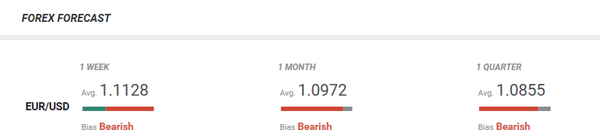
Tip: When choosing forex pairs to trade, make sure to select forex pairs that have the same tendency for all three time horizons. FXStreet's EUR/USD forecast has a bearish bias for each time horizon.
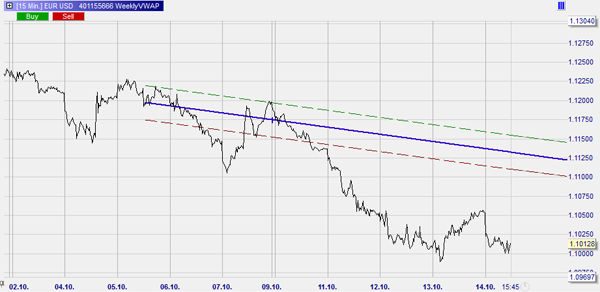
The Friday afternoon forecast published by FXStreet is 1.1128. The EUR/USD closed the day at 1.1196. The predicted move equates to -68 pips or $680 on a standard EUR/USD lot. This is how the forecast looks on the chart.
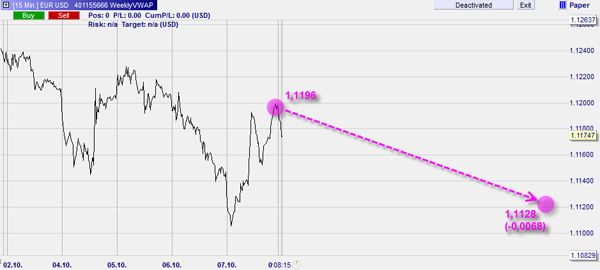
Important: In NanoTrader it is possible to leave n% of the chart free for the future. This trader sets 50%. The space for the chart of the past week and for the future week are therefore identical. This allows the trader to draw into the future.
Five different strategies to trade the FXStreet forecast
1. The simple solution
The simple solution is to place a sell stop order slightly below Friday's close. Once the position is opened, place a stop-loss order and a limit order. The limit order is placed on the FXStreet forecast of 1.1128.
In the FXStreet EUR/USD forecast example, the simple solution looks like this: The blue line is the entry, the green line is the limit and the red line is the stop.
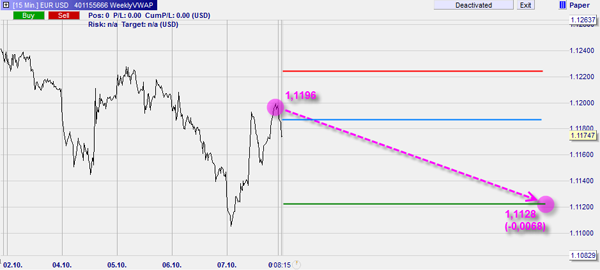
2. Using support and resistance levels
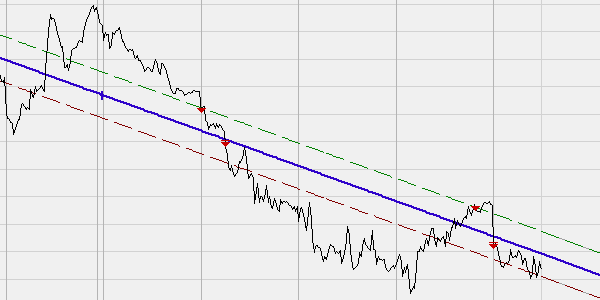
A second way to trade forecasts is to identify support/resistance levels in last week's chart. When a resistance level is broken, the market often accelerates. The number of levels to identify can vary.
In the FXStreet EUR/USD forecast example, the trader has identified three resistance levels. One of these lines has already been broken.
Practical application of these two strategies in NanoTrader
Settings:
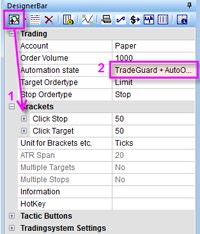
1. Insert a "Click Stop" and a "Click Target" relatively far away from the market price.
2. activate the TradeGuard. When you open a position, NanoTrader will automatically place the stop and limit.
3. At the beginning of the week, in case of a positive forecast, place a buy stop slightly above the market price. In the case of a negative forecast, place a sell stop slightly below the market price.
4. Once the position is opened, move the limit order to the forecast level. The limit order is placed automatically by TradeGuard if it is activated. This is possible by clicking on the arrow in front of the order label and moving the order.
5. Once the position is opened, drag the stop order to the level of your choice. The stop order is placed automatically if TradeGuard is activated. Click on the arrow in front of the order label and drag it to the level of your choice. For example, you can select a level based on the previous week's chart or you can select a level where your risk-reward ratio (RRR) is at least 1. You can see your risk-reward ratio in the chart and in the account bar.
In the example of FXStreet EUR/USD, this looks like this:

3. Using Fibonacci levels
Traders with a preference for Fibonacci can use Fibonacci levels to open positions.
In the FXStreet EUR/USD example, the 5 Fibonacci levels relevant for trading are visible. The highest Fibonacci level has already been broken.
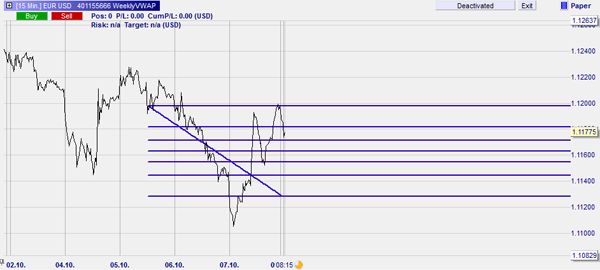
Tip: To draw in the Fibonacci levels, start at the level of Friday's close (1.1196) at noon on Wednesday. The diagonal line is drawn from Friday's close to the FXStreet forecast level (1.1128). The top line is thus at the closing price of 1.1196 and the bottom line is at the forecast level of 1.1128. This results in five relevant Fibonacci levels.
Practical application of the Fibonacci strategy in NanoTrader
How to draw in the Fibonacci levels is described above.
Settings:
1. Add a "Click Stop" and a "Click Target" and place them relatively far from the market price.
2. activate the TradeGuard. When you open a position, NanoTrader will automatically place the stop and limit orders.

3. In the case of a positive forecast, place buy stop orders at all Fibonacci levels at the beginning of the week. In case of a negative forecast, place sell stop orders at all support levels of the previous week. 4.
4. Once a position is opened, you can move the limit order to the predicted level. TradeGuard will automatically place the limit order if it is activated. By clicking on the arrow in front of the order label, you can move the order. 5.
5. Once a position is opened, you can move the stop order to a level of your choice. TradeGuard will automatically place the stop order if it is activated. You can move the order by clicking on the arrow next to the order label. For example, you can select a level based on the previous week's chart or you can select a level where your risk-reward ratio (RRR) is at least 1. You can see your risk/reward ratio in the chart or in the account bar. If more orders are executed, for example because the market moves in the predicted direction, you can move the stops again.
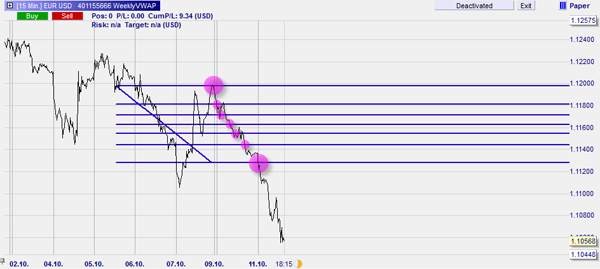
Note: As more entry orders are executed at the different Fibonacci levels, NanoTrader adjusts the volume of the stop and limit orders.
In the FXStreet EUR/USD forecast example, the trader opens five short positions, with the profit target being reached on Tuesday morning.
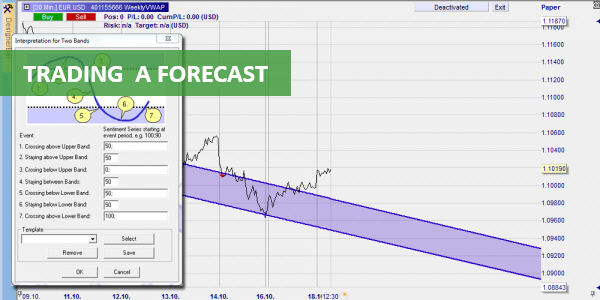
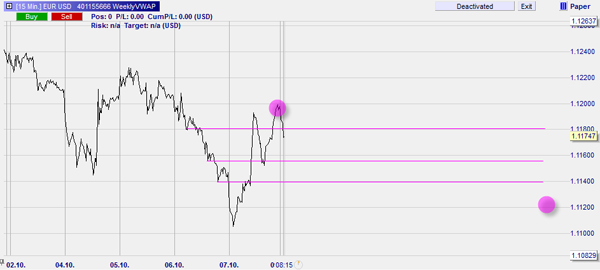
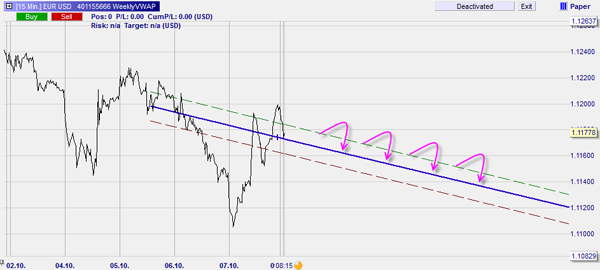
4. Using a trading line
The fourth option is to draw a trading line. The trading line connects the predicted level and a point in the previous week. There are several ways to set this point. One could use the weekly VWAP or the mid-week price, etc.
In the FXStreet EUR/USD example, the forecast is below the current market price. The trader opens a short position when the market enters the upper range. The position is closed when the trading line is touched.
Tip: There is no fixed rule on how to draw the trading line. When choosing the price to be linked to the forecast price, there are several possibilities. One could use the weekly VWAP or the mid-week price, etc.
Practical application of the trading line strategy in NanoTrader
How to draw the trend line is explained above. 1.
1. Draw the trend line and select "Sentimentor".
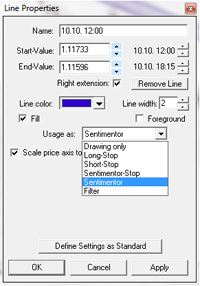
2. It is possible to change the distance between the catchment areas.
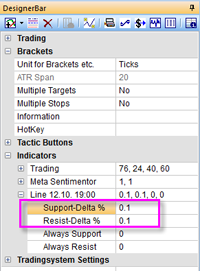
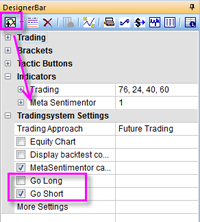
3. Add the MetaSentimentor.
4. in the trading system settings, select either "Go Long" or "Go Short" depending on the direction of the forecast. In the FXStreet example, we choose "Go Short" because the forecast is below Friday's close.

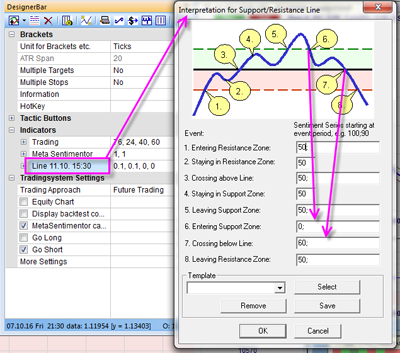
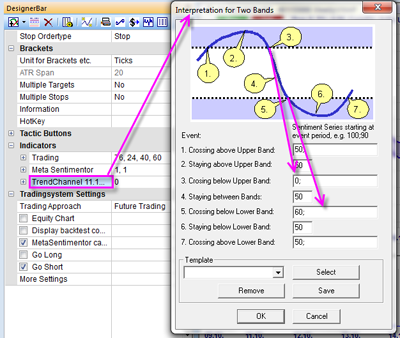
5. Double-click on the line in the designer bar to open the interpretation window for the (semi-)automatic trade (0 means short, 100 long, 50 neutral, 40 means close long, 60 close short). Enter 0 in the 6th field to go short when the market price enters the upper band and 60 in the 7th field to close the position when the lower end of the channel is reached. The other values can be set to 50. You can also opt for other interpretations.
6. To have the platform close the manually opened positions, activate TradeGuard. With the "AutoOrder" function, you can have positions opened and closed by the platform.
In the FXStreet EUR/USD forecast example, the market was not between the bands at any time. Therefore, no position was executed.
In this example, the market enters and exits the upper band, resulting in two trades.
5. Using a trend channel
A fifth option is to draw a trend channel. Each time the market enters the channel, the trader opens a short position. The profit target is the lower line of the trend channel.
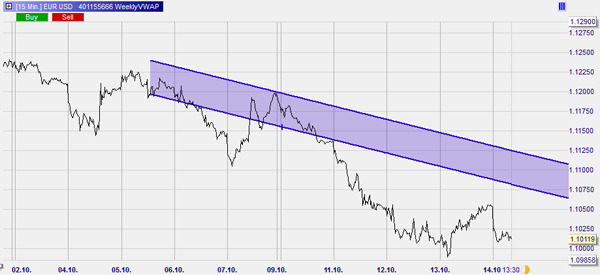
In the FXStreet EUR/USD prediction example, the trend channel looks like this:
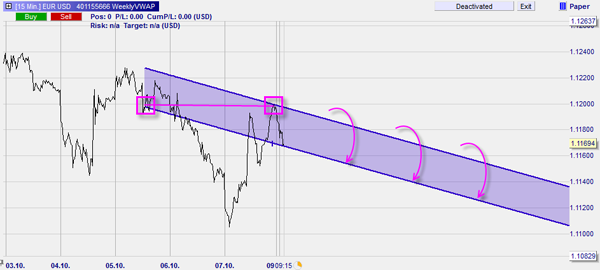
Tip: To draw the trend channel, start at the level of Friday's close (1.1196) at noon on Wednesday. The other side of the trend channel runs through the same price level from Friday. The middle of the trend channel ends at the FXStreet forecast (1.1128).
Practical application of the trend channel strategy in NanoTrader
How to draw the trend channel is described above.
1. Draw the trend channel and select "Sentimentor".

2. Add the MetaSentimentor.
3. In the trading system settings, select either "Go Long" or "Go Short" depending on the direction of the forecast. In the FXStreet example, we choose "Go Short" because the forecast is below Friday's close.
4. Double-click on the trend channel field to set the interpretations for (semi-)automatic trading (0 means short, 100 long, 50 neutral, 40 stands for close long and 60 close short) . Enter 0 in the 3rd field to go short when the market price enters the upper band and 60 in the 5th field to close the position when the lower end of the channel is reached. The other values can be set to 50. Traders can also opt for other interpretations.
5. To have the platform close the manually opened positions, activate TradeGuard. With the "AutoOrder" function, you can have positions opened and closed by the platform.
In the FXStreet EUR/USD forecast example, the market never entered the trend channel from above. Therefore, no order was executed.
x
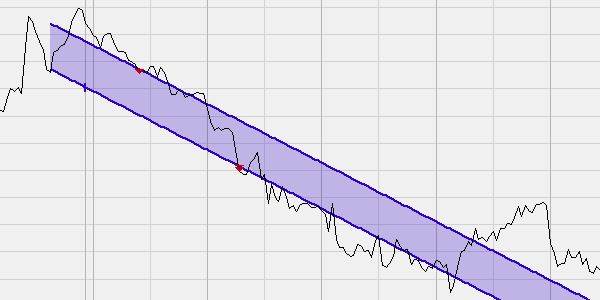
In this example, the market enters the trend channel, opening a position. The position is closed when the market reaches the bottom of the channel.
Recommended broker
People also read
Trading strategy using forex gaps
Free demo

Trading videos
Charting, strategies, automated trading, backtesting, playback... watch these videos and become a platform master.

Broker
WH SelfInvest serves traders from offices in Germany, France, Switzerland, Belgium, Luxemburg and the Netherlands.
The spectacular SignalRadar
SignalRadar shows live trades being executed by various trading strategies.
More ...
- ‹ previous
- 2 of 5
- next ›