Test NanoTrader Full I Test Tradingview I Test the mobile platforms All for CFD-Forex & Futures
You are here
Trading signal: 3 line break

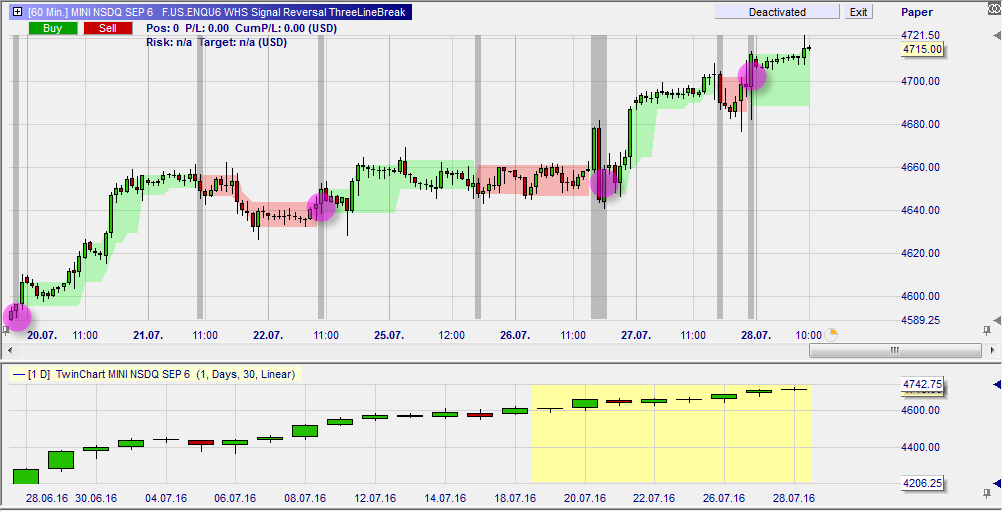
Three line break charts are popular with traders. The charts indicate the start of a trend reversal fairly accurately. Being not time-based three line break charts are difficult to observe and interpret. The NanoTrader solves this by converting them into clearly visual bands.
The three line break bands are a trading signal in NanoTrader. If a trend reversal occurs the trader gets a signal and, if desired, an order is generated automatically.
The advantages of the three line break signal are:
- A difficult to interpret but quality chart is converted into an easy to interpret band.
- Trend reversals are detected in their early stages.
- The trading signal can be used in all time frames.
- The trading signal can be used on all instruments.
- The trading signal can open a position, the trader is free to manage the position afterwards.
The three line break signal is one of the many free trading signals available in NanoTrader.
1. THE DIRECTION OF THE TREND
In the example above (60-minute chart) the Twin Chart in the higher time frame (1 day) shows the trader the main trend is positive. The trader is therefore only interested in buy signals i.e. points in time when the market returns to the main trend. The buy signals are indicated by the small circles. Notice that the three line break band is green after the signal. A green three line break band indicates that the market is in a positive trend.
2. EXAMPLE GOLD
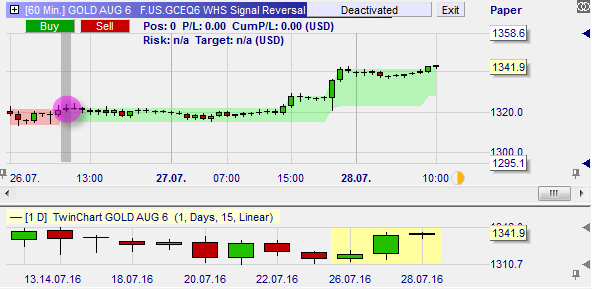
This example shows gold (60-minute chart). The Twin Chart below the main chart shows that in the last three days the gold price started to rise. The trader sees when this rise is not just a rise but a trend reversal when the three line break band gives a signal and turns green. This is a buy signal.

This video shows the trading signals:


